


Nutritional status of children population in Asturias (SNUPI-AS study): thinness, overweight, obesity and stunting
Begoña Domínguez Aurrecoecheaa, Manuela Sánchez Echeniqueb, M.ª Ángeles Ordóñez Alonsoc, José Ignacio Pérez Candásd, J Delfrade Osinagae
aPediatra. Instituto de Investigación Sanitaria del Principado de Asturias (ISPA). Asturias. España.
bPediatra. Servicio de Planificación y Gestión de Atención Primaria. Navarra. España.
cPediatra. CS La Corredoria. Instituto de Investigación Sanitaria del Principado de Asturias (ISPA). Oviedo. Asturias. España.
dPediatra. CS de Sabugo. Avilés. Asturias. España.
eTécnico del CIBER. Instituto de Salud Pública Navarra. Navarra. España.
Correspondence: B Domínguez. E-mail: begoa.dominguez@gmail.com
Reference of this article: Domínguez Aurrecoechea B, Sánchez Echenique M, Ordóñez Alonso MA, Pérez Candás JI, Delfrade Osinaga J. Nutritional status of children population in Asturias (SNUPI-AS study): thinness, overweight, obesity and stunting. Rev Pediatr Aten Primaria. 2015;17:e21-e31.
Published in Internet: 18-03-2015 - Visits: 59487
Abstract
Objectives: toassess the nutritional status of children under fifteen years old of the Principality of Asturias, identifying those parameters altered by excess or defect and to return the information obtained to pediatricians and managers.
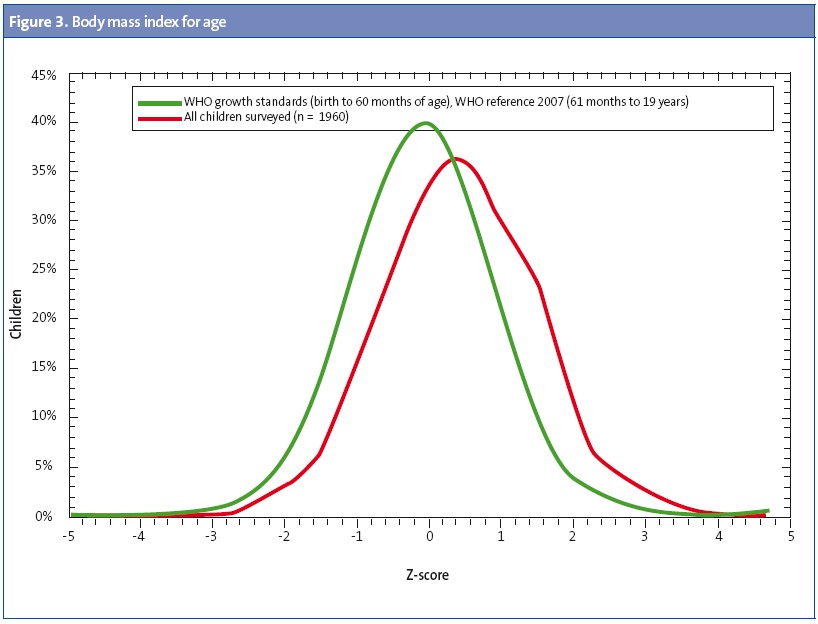
Methods: retrospective cross-sectional descriptive study. Target population: children under 15 years old of Asturias born between 1995 and 2012. Data source: computerized records at primary care clinic. Variables: last recorded weight and size, extent and date of birth, gender, and codes: area, base area and pediatrician. Indicators calculated: weight/age; size/age; body mass index (BMI)/age and weight/length (<five years). Patterns used for comparison: WHO standards and used the software ANTHRO and ANTHRO PLUS. The standard deviation (SD) by age and sex for BMI/age, height/age and weight/age, (Z-standard) and the prevalence of each variable adjusted for age and sex were calculated for each child.
Results and conclusions: a net basis with 89,989 records was obtained: 50.98% boys and 49.02% girls. They presented stunting 1.8%; 66.56% normal weight; 22.5% overweight; 10.9% obese; severe obesity 1.9% and 1.1% thinness. By gender, the rate of obesity is higher in boys (12.4) than girls (9.2). By age, the rate of overweight was higher in children between 10 and 14 years (41.9). Children between 5 and 9 years had the highest rate of obesity (15.1) and severe obesity (3.7). The differences in prevalence of overweight among 68 basic areas studied reach 20 points; knowledge will establish priority areas for intervention
Keywords
● Asturias ● Idiophatic short stature ● Infantile ● Nutrition ● Obesity ● Overweight ● SpainINTRODUCTION
Many studies demonstrate the importance of adequate nutrition for the proper development and health of children and adolescents and its impact in future health, both at the individual and the community levels. The impact of nutrition on health can even reach across generations, as shown by the epigenetic research of Pembrey and Sjöström.1,2
While in developed countries the prevalence of excess weight, inclusive of overweight and obesity, is the most pressing concern, it is also important to detect areas with abnormally low weight resulting from individual factors, the socio-cultural environment and the economic crisis.
We felt that it would be useful to assess the current situation to obtain information on the main areas requiring especial intervention, particularly at this time when, due to the crisis, we must be alert to possible pockets of malnutrition.
The reports published by the International Association for the Study of Obesity (IASO)3 in 2007 showed that the countries with the highest rates of overweight in children and adolescents were Spain (35% in males and 32% in females), followed by Malta (30.9% and 20.1%), Portugal (25.9% and 34.3%), Scotland (29.8% and 32.9%) and England (29% and 29.3%).
Still, the variability in the criteria used to defined overweight and obesity and the fact that each country has developed its own growth charts for both cross-sectional and longitudinal4,5 data make the comparison of data difficult.
To address these problems, the World Health Organization (WHO) led the development of charts with a prescriptive approach that show how children should grow when their environment allows the optimal development of their genetic potential. In 2006, the WHO6 presented these charts for children under 5 years of age, which have already been adopted by more than 125 countries. As an extension of these charts, in 2007 the WHO presented growth references for schoolchildren 5 to 19 years of age 7, so that homogeneous criteria are available for making assessments and comparisons. The WHO has also published support software, ANTHRO (age 0 to 60 months) and ANTHRO PLUS (age > 5 years) that can be used to analyse the nutritional status of individuals and groups, facilitating the analysis and enabling worldwide comparison of data.8,9
A study of the population under 15 years of age has been conduced in Navarra in the years 2007, 2009 and 2011 and 2013, revealing the ongoing trends.
Few studies focus on primary care (PC) and its important role in the early diagnosis of nutritional disorders. Considering that children are continuously monitored from birth to 14 years of age in our public health system, PC is the perfect setting to achieve these objectives.
OBJECTIVES
Our overall aim was to assess the nutritional status of the population under 15 years of age receiving care at the health care centres of the Principality of Asturias, determining the prevalence of short stature, overweight, obesity, severe obesity and underweight based on the WHO standards.
Our specific objectives included giving detailed feedback to healthcare professionals and providing the public health authorities with an overview of the areas with the higher and lower prevalences to assist them in planning and prioritising intervention strategies.
MATERIALS AND METHODS
We conducted a cross-sectional retrospective descriptive study. We built a database with the following characteristics from the review of the electronic medical records held by the Servicio de Salud del Principado de Asturias (Department of Health of the Principality of Asturias, SESPA):
Sample universe: all children younger than 15 years born between January 1, 1995 through March 2012 that received services at any health care centre in Asturias. We included the data of all children in this age group, including those for who there were no weight or height data available, in order to be able to assess healthcare coverage in relation to the entire universe.
Data, collected from the medical records of each child, for the following variables: date of birth, sex, most recent weight and height (if both were measured the same day), date of weight and height measurement, number of health identity card (tarjeta individual sanitaria [TIS]), country of birth, basic health zone or health care centre, and physician identification code (CIAS) of the doctor in charge.
To guarantee confidentiality, we unlinked each patient’s data from the TIS and provided a different number that would not allow researchers to identify the patient. The data collection department kept a file linking each real TIS with the new value. Once the data were processed and the analysis results were obtained, the reverse process was used to submit to clinicians the data pertaining to their patients.
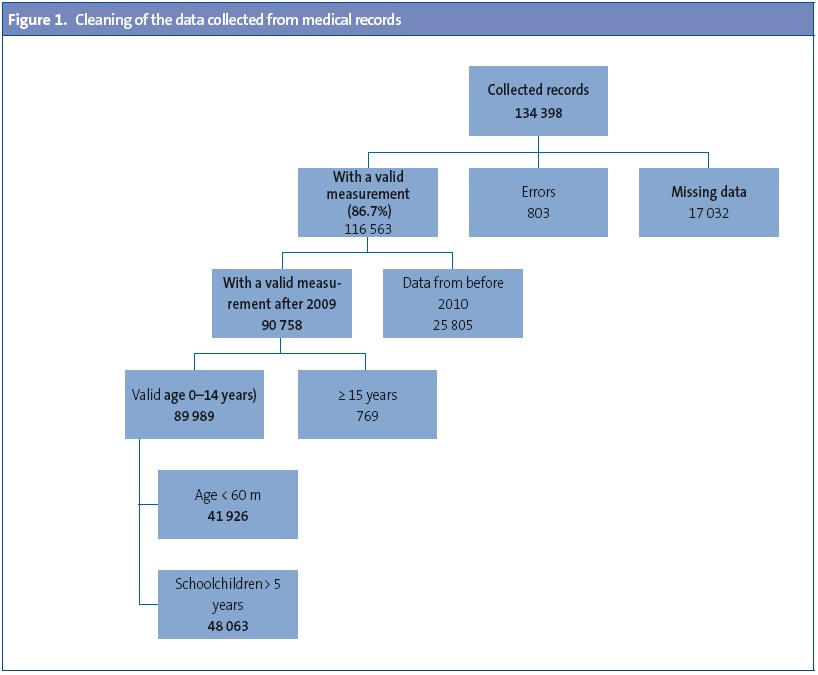
After gathering the raw data, we removed erroneous data, data for children older than 14 years and records of measurements taken before 2010, keeping only data entered after January 2010 (Appendix 1, Figure 1).
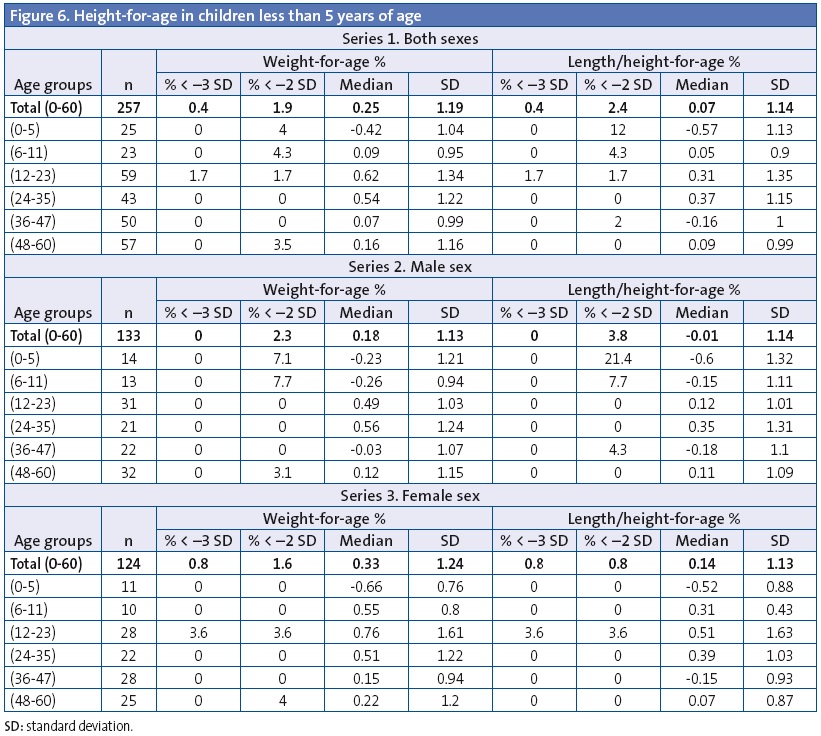
Calculated indicators: weight-for-age, height-for-age, body mass index (BMI)-for-age, and weight-for-height (age < 5 years).
Standards used for reference: WHO growth standards, and after cleaning the data and obtaining a dataset of 89 989 records, the Nutritional Survey tool of the WHO ANTHRO and ANTHRO PLUS applications, used to calculate the age-sex-adjusted SDs for BMI-for-age, height-for-age and weight-for age for each child.
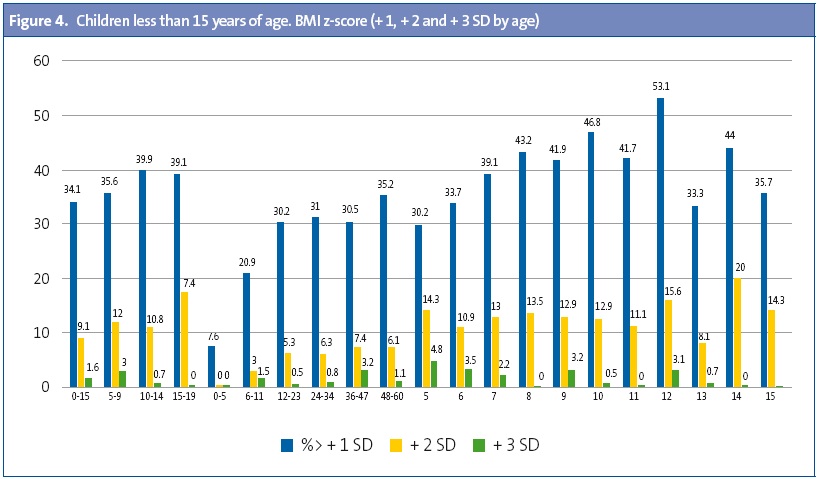
These applications were also used to obtain the following data: percentage of children with excess weight, which included overweight and obesity (BMI/age > +1 SD); percentage of children with obesity (BMI/age > +2 SD); percentage of children with severe obesity (BMI/age> +3 SD); percentage of children with underweight (BMI/age < –2 SD); percentage of children with severe underweight (BMI/age < –3 SD); percentage of children with low weight-for-age (weight/age < –2 SD); percentage of children with low height-for-age (height/age < –2 SD).
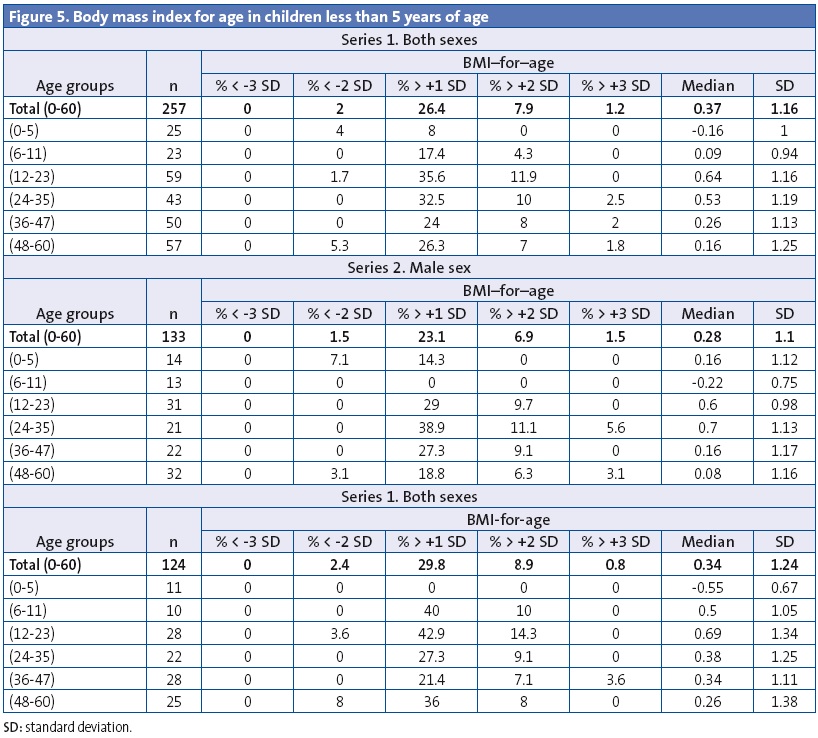
In children younger than 5 years (60 months), the WHO recommends defining overweight as a BMI 2 SD or more above normal to prevent the use of restrictive diets in children during this important period of growth.10
The z-scores for anthropometric indicators were calculated for every child.
We have expressed the prevalence of each variable in graphical and numerical formats, both overall and by age group, sex, and different health care levels (caseloads; the 68 basic health zones; the 8 health care areas; and the autonomous community [AC]).
We present the results accompanied by their confidence intervals, medians, and standard deviations.
To compare the prevalence in different basic health zones, we calculated the prevalence adjusted for age and sex (direct method). To calculate the total population of the different basic health zones under study, we used the data of the Consejería de Salud (Department of Health) of the Principality of Asturias for year 2012.
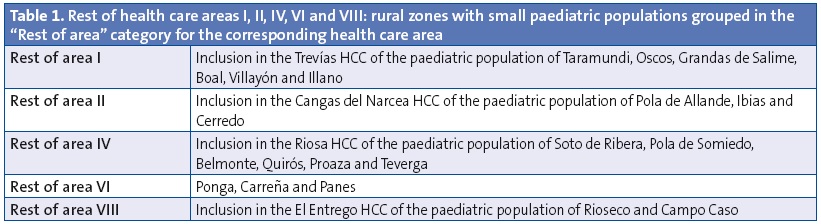
Some basic zones with small paediatric populations were grouped under the label “rest of the area” (Appendix 1, Table 1).
We ranked the basic health zones by their adjusted prevalence of overweight and obesity, and also assessed whether there were statistically significant differences between these rates and the mean prevalence of overweight and obesity in Asturias.
RESULTS
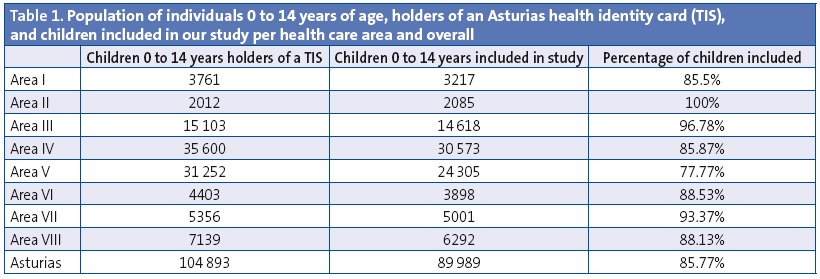
The study included 89 989 children, of which 49.02% were girls and 50.98% boys. The included children constitute 85.77% of the population of children 0 to 14 years of age holding a TIS of the Principality of Asturias in year 2012, which amounts to a total of 104 893 (Table 1).
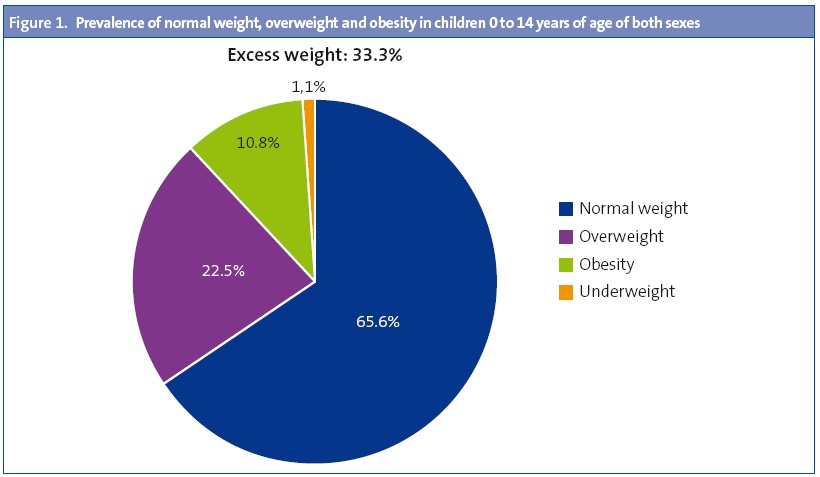
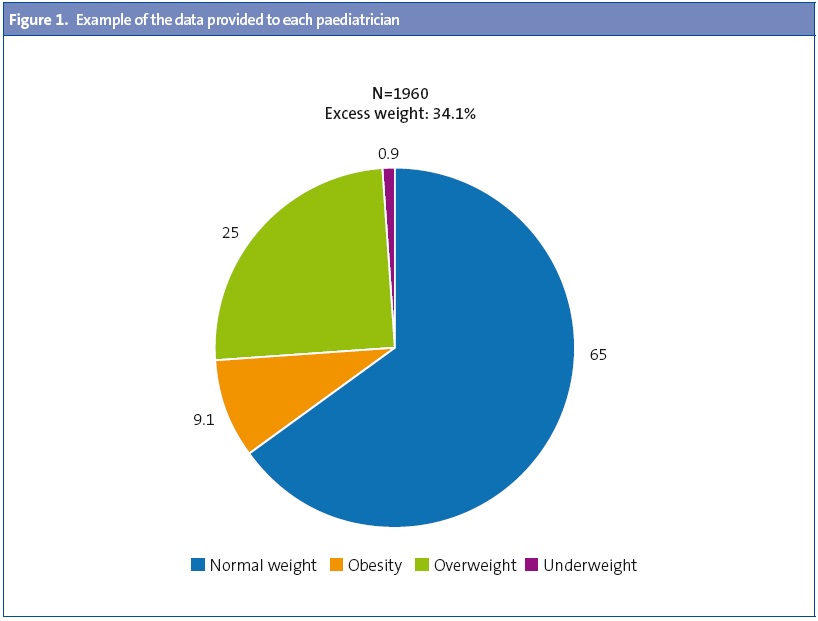
The prevalence of underweight was 1.1% and the prevalence of short stature was 1.8%. The prevalence of normal weight was 65.6%; that of overweight 22.5, and that of obesity 0.8% (Figure 1).
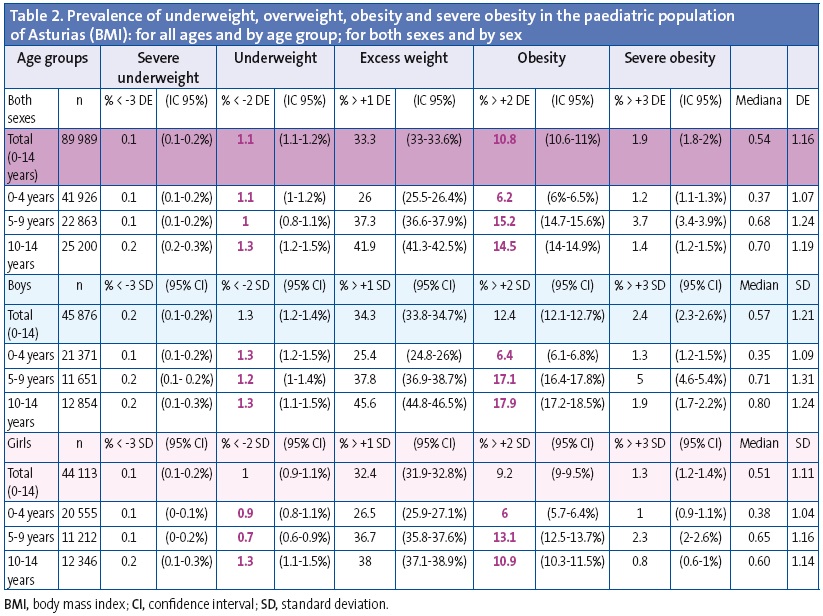
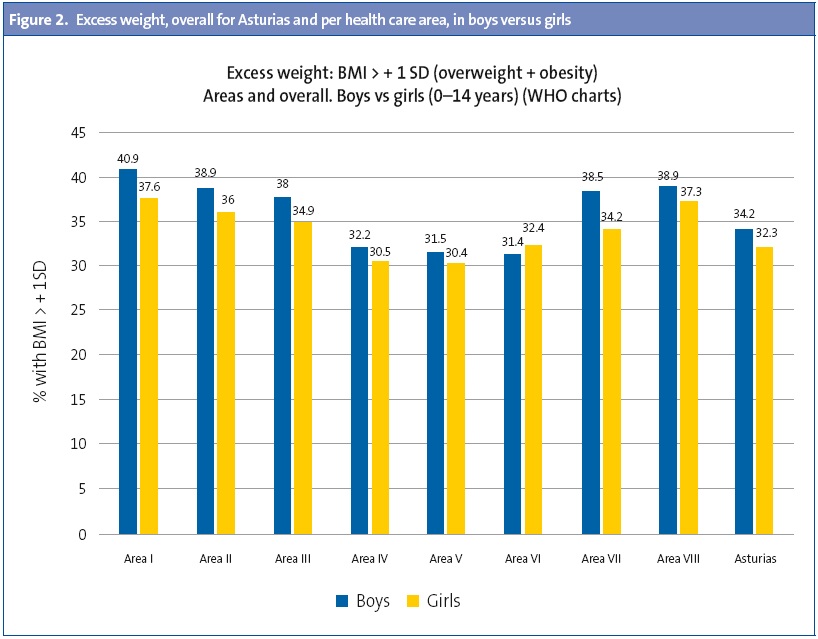
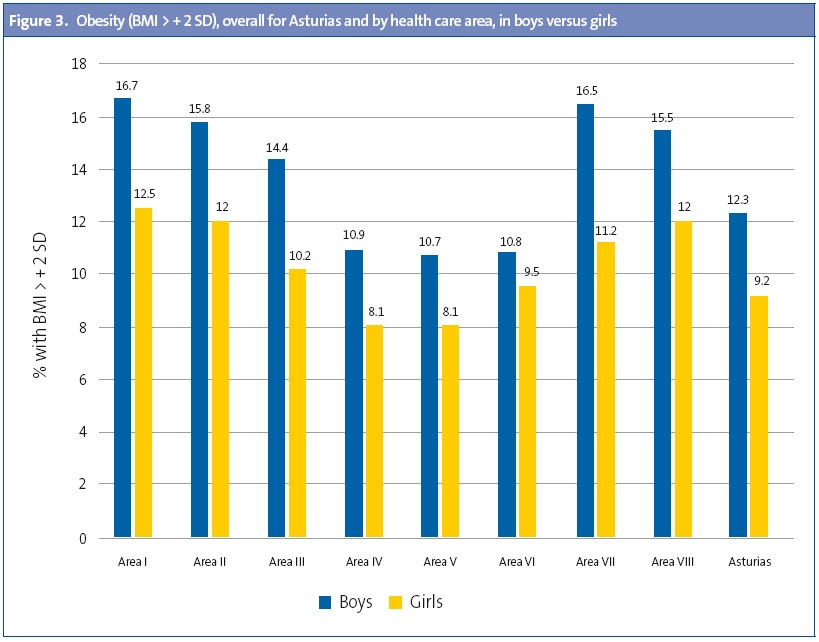
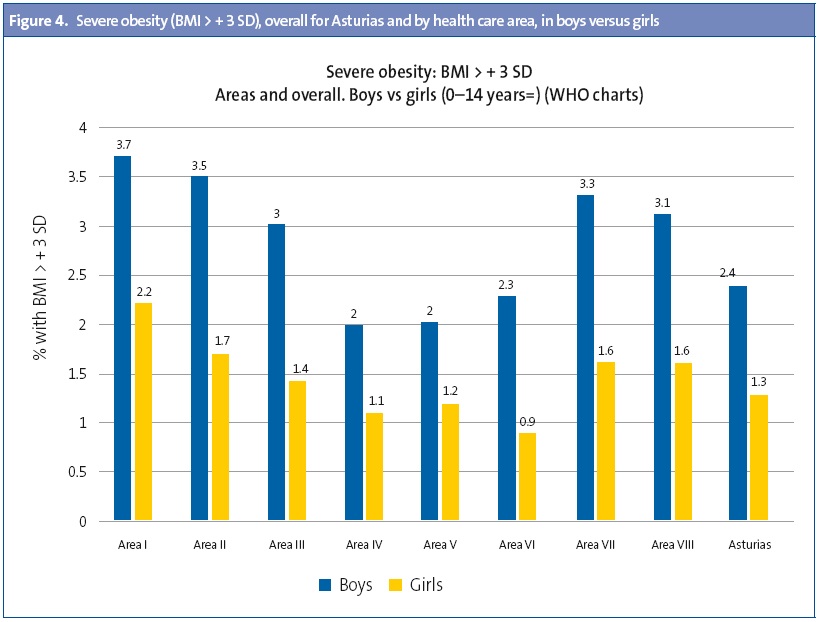
By sex, the overall rate of excess weight (overweight + obesity) in Asturias was higher in boys (34.3) compared to girls (32.4); which was also true of obesity (boys, 12.4%; girls, 9.2%) and severe obesity (boys, 2.4%; girls, 1.3%). Table 2 shows the data for Asturias by age range, expressed as median, SD and CI.
By age, excess weight was most prevalent in children 10 to 14 years of age; while obesity and severe obesity were most prevalent in the 5-to-9 years age group (Table 2).
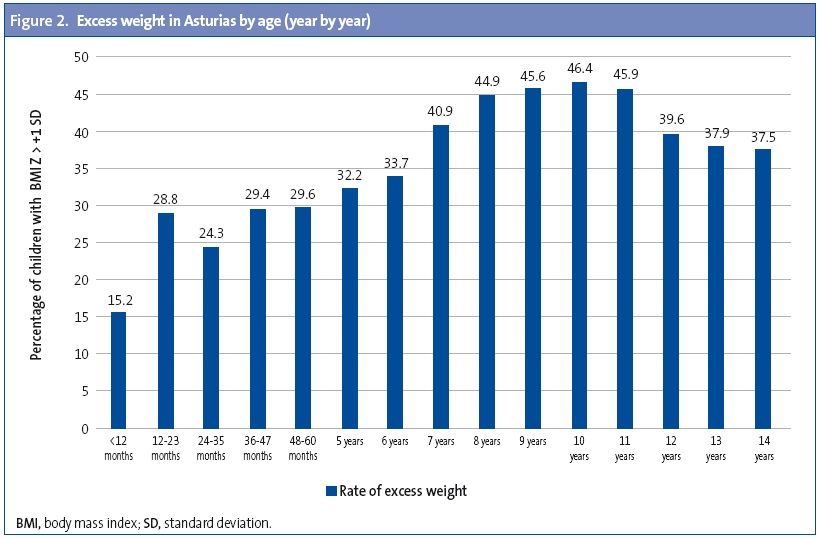
A detailed year-by-year analysis showed that a significant increase in excess weight occurs between the first and second years of life (28.8%), a trend that is sustained until age five years (29.6%); a new peak is observed between ages 7 and 11 years, and the prevalence then descends through age 14 years (Figure 2).
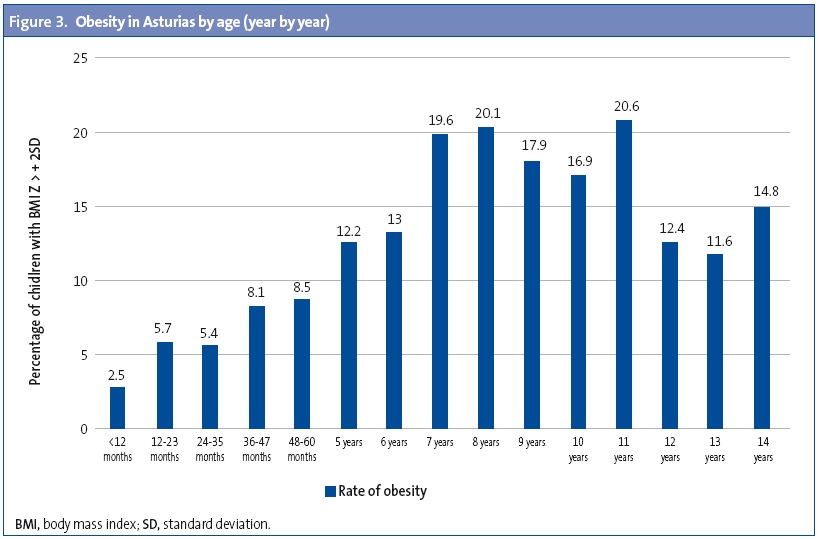
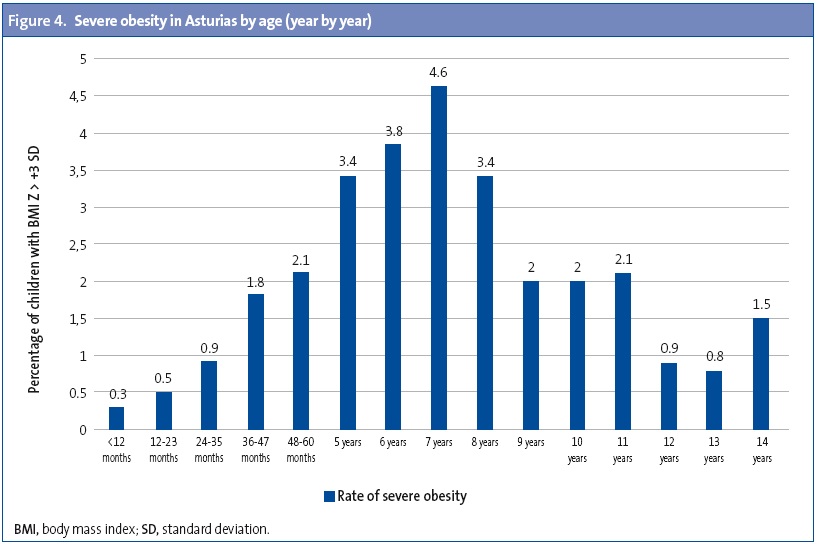
We found the highest rates of obesity in children 7 to 11 years of age (Figure 3) and of severe obesity in children 7 and 8 years of age (Figure 4).
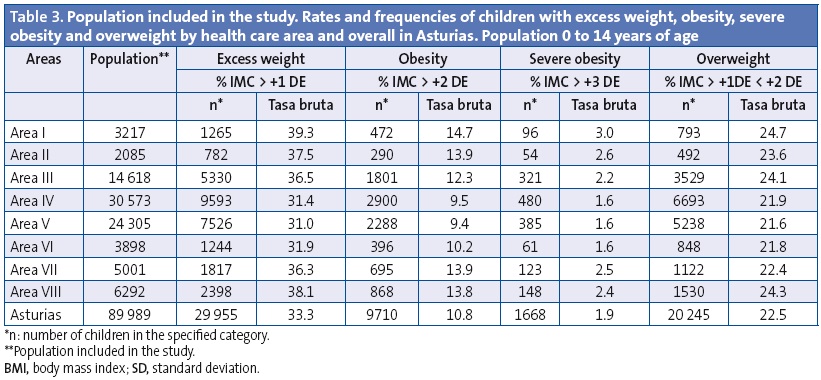
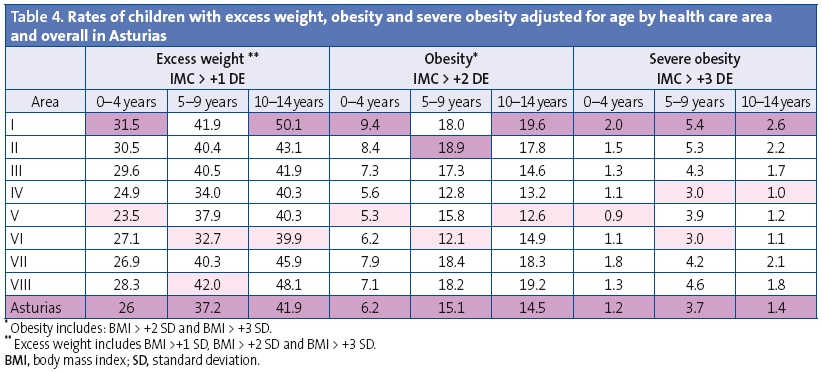
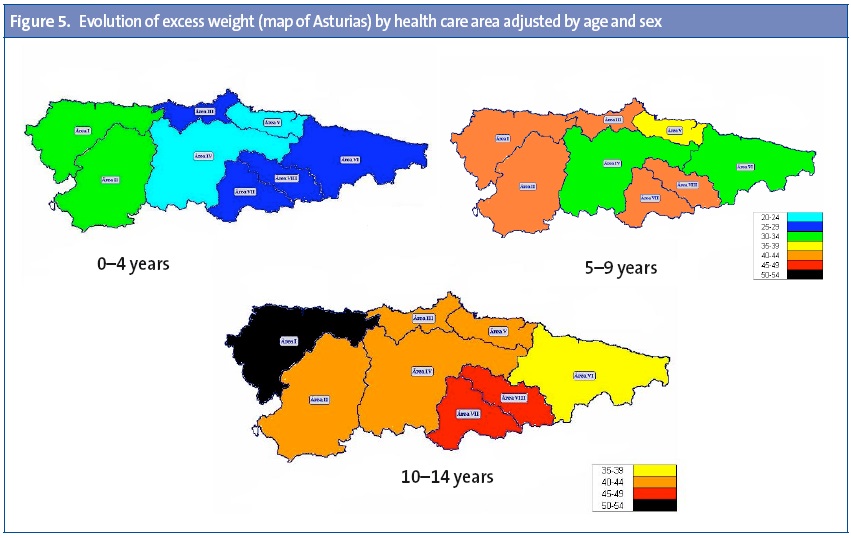
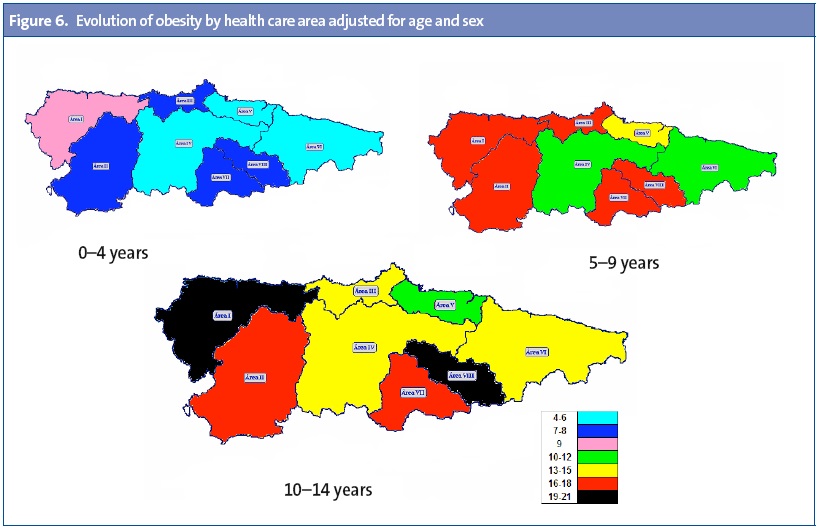
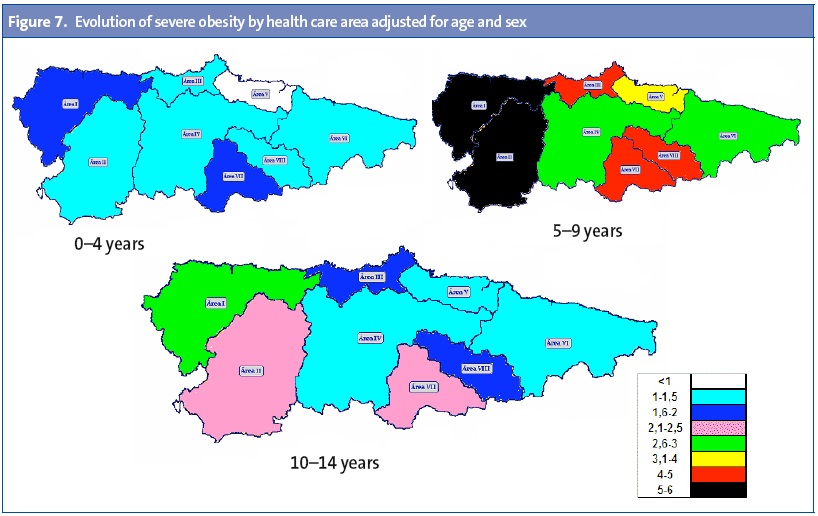
There were significant differences between health care areas (Table 3), with the highest rates of excess weight, obesity and severe obesity found in area I. Areas IV, V and VI had the lowest prevalence rates in every category. When we analysed by age group, area I had the highest rates for all age groups save for the highest obesity rate in children 5 to 9 years of age, which was found in area II, and the highest rate of excess weight in the same age interval, found in area VIII (Table 3). The results for the evolution of excess weight (Figure 5), obesity (Figure 6) and severe obesity rates (Figure 7) over different age intervals are represented in detail and for different areas in the health care map of Asturias (Appendix 1).
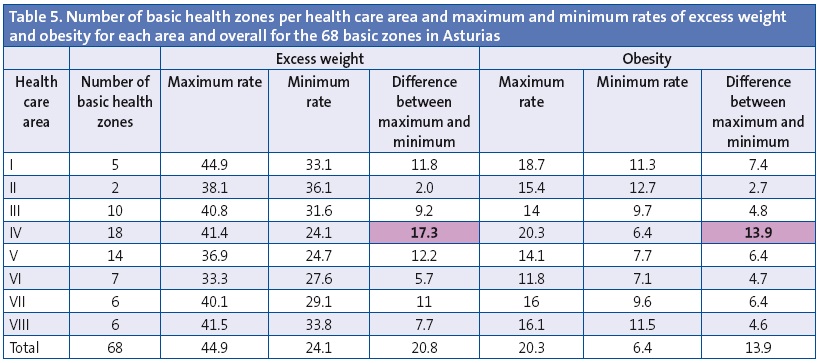
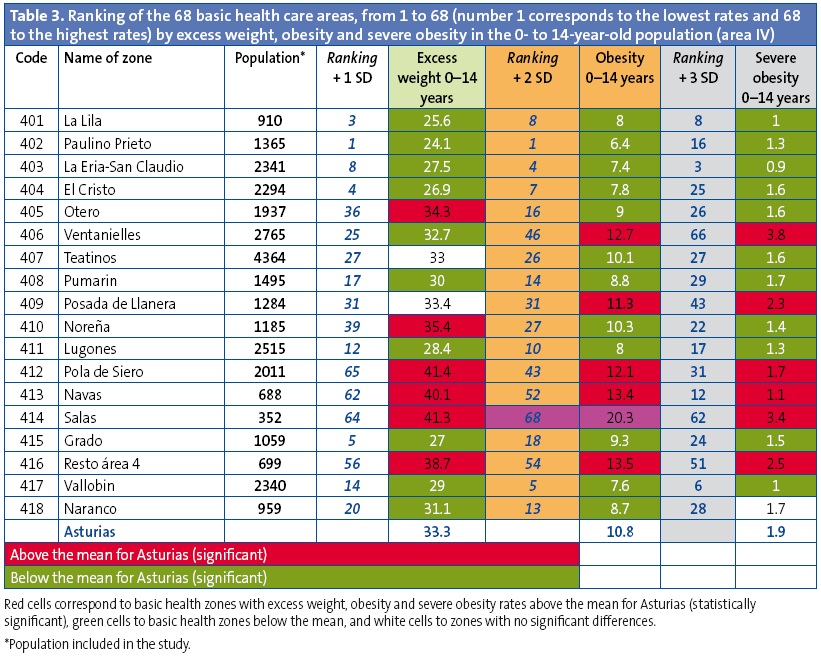
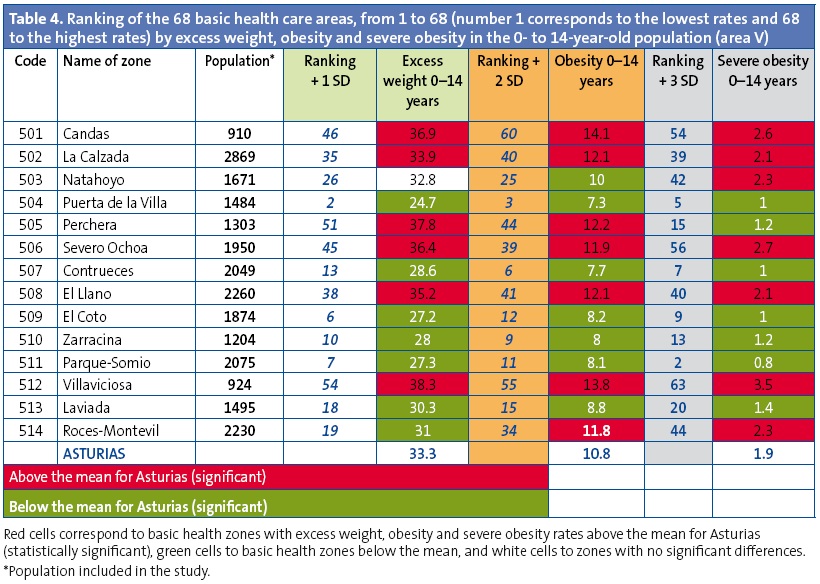
The differences in the prevalence of excess weight and obesity are considerable even between basic health zones belonging to a single health care area. We found the smallest differences (2 points) in area II, which only has two basic health zones. The largest differences were found in area IV, which comprises 18 basic health zones, with the highest difference reaching 17.3 points (rate range, 24.1%– 41.4%) (Table 4).
The differences between the 68 basic health zones under study reach 20.8 points for excess weight (rates ranging between 24.1% and 44.9%) and 13.9 points for obesity (rates ranging between 6.4% and 20.3%).
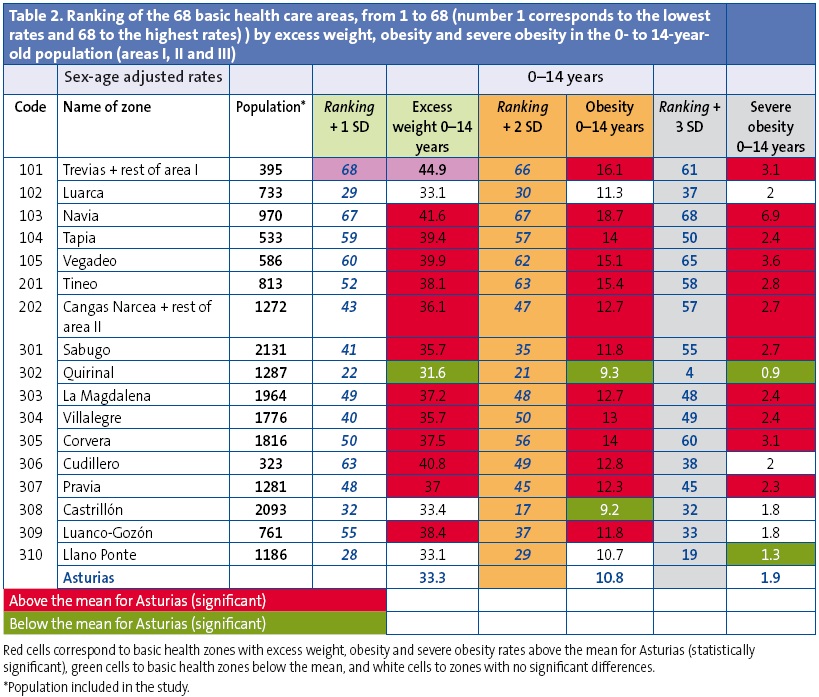
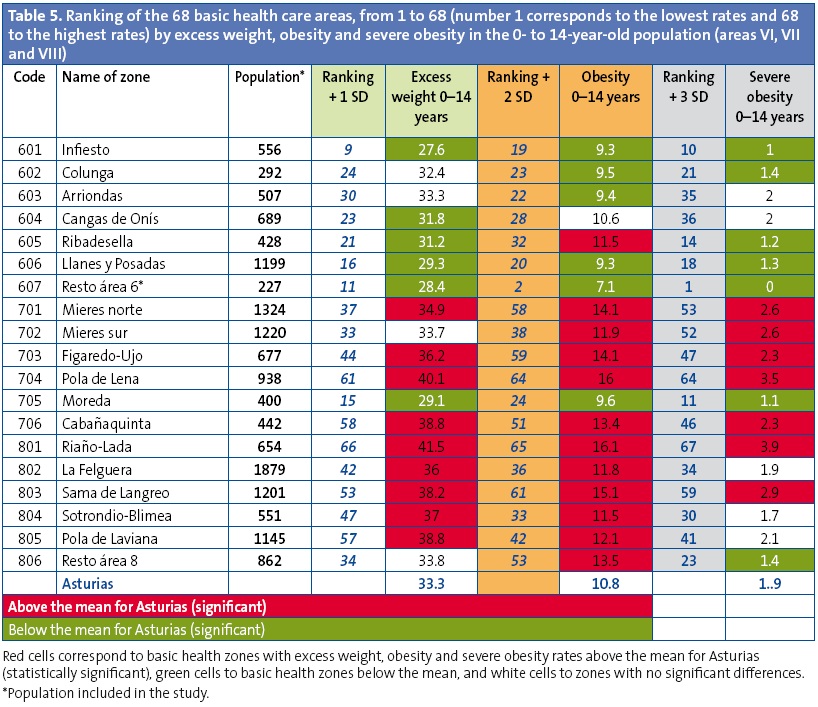
We did a ranking of the basic health zones, classifying them according to their adjusted prevalences of overweight, obesity and severe obesity. Prevalences were marked in red if they were significantly above the mean for Asturias, green if they were significantly below the mean for Asturias, and white if there was no statistically significant difference (Appendix 1, Tables 2, 3, 4 and 5).
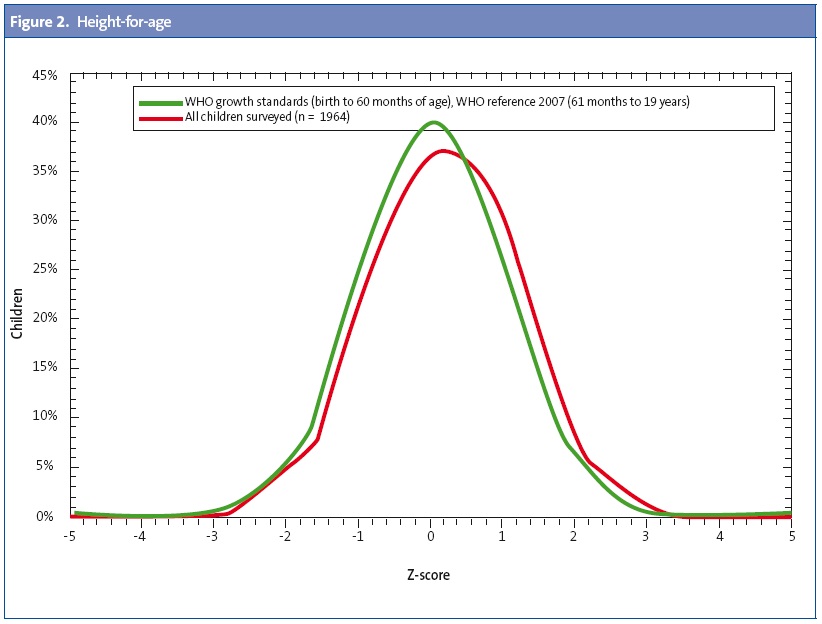
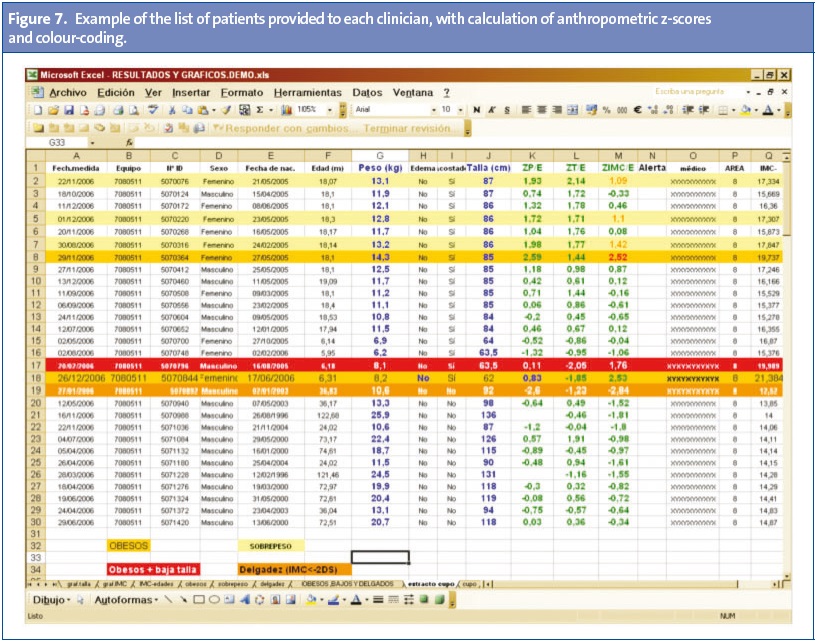
We calculated the following values (Appendix 2) for the group of patients corresponding to each paediatrician: 1) prevalence of short stature, underweight, overweight, obesity and severe obesity; 2) comparison of their patients with the WHO growth charts for height-for-age and BMI-for-age, and 3) a listing of their patients with the corresponding z-score for height-for-age, weight-for-age and BMI-for-age (anthropometric Z-scores).
DISCUSSION AND CONCLUSIONS
Due to its design, this study offers some advantages for clinicians compared to other published works. First of all, our comparisons are based on international criteria and standards proposed by the WHO, which provide healthy references that are valid for clinical and epidemiological use, and precludes the inconsistencies found in the values of other studies that use epidemiological criteria that differ from the standards used in clinical practise.
Secondly, the study used all the records for holders of a TIS younger than 15 years. In Spain, every child has the right to receive health care, whether their presence in the country is regular or irregular. This has made it possible to calculate anthropometric z-scores for all children and to do an overview of the nutritional status of the paediatric population of Asturias from the individual level to the levels of paediatrics caseloads, basic health zones, health care areas and autonomous communities.
Another added benefit is that it was not necessary to invest additional resources in collecting the raw data; usually, data gathering is one of the most difficult tasks, requiring greater investments.
Limitations
There are several limitations to this study:
- There is a single entry for each child that corresponds to the latest measurement, so we could not detect potential fluctuations over time. Since in most children anthropometric measurements are taken during visits scheduled in the context of the well child programme, the measurements of older children cluster in specific ages (6, 10–11 and 13–14 years), so for ages in which routine checkups are not usually scheduled, the frequency (n) of the records differs from the frequencies of contiguous years. For this reason, and especially when it comes to areas with small populations in which the number of children for each year of age is small, we recommend interpreting the data with caution and in broader age intervals.
- While the anthropometric measurement tools used in every health care centre are certified and the measurements are taken by nurses and paediatricians with specialised training, it is possible that the measurements, taken by many different agents, may be erroneous due to poor execution or incorrect documentation. However, since clinical decisions are made based on these results, we believe that the benefits greatly outweigh the potential margin of error, which in any case would be much lower than that of other studies based on parent surveys or samples that when generalised would only be representative at the autonomous community level, but not at the local level. We must also consider the value of this study, which gives back data to paediatricians about their patients, something that is not done in other works.
- We do not have socioeconomic or family data allowing us to study the causes of our findings, although the geographical distribution suggests that the values observed in isolated rural areas are clearly worse, suggesting the existence of multifactorial causes, especially for overweight and obesity, as we did not observe significant differences in any other parameter (short stature and low weight and BMI).
Results
The most salient finding of the study was that there was no evidence of pathology due to malnutrition in the paediatric population of Asturias during this period of economic crisis in which the estimates of child poverty in Spain are high, since a 1.1% rate of low weight and low BMI is within the expected range and can be attributed to chronic conditions, preterm birth, etc. Short stature, which can also be indicative of malnutrition, had a prevalence of 1.8%, which is within normal ranges.
Our results showed a high prevalence of excess weight with a very heterogeneous distribution across health care areas and basic health zones.
We ought to note that the obesity rate approximates the mean for Asturias at early ages: at age 3 years it is already as high as 8.1 (mean, 10.8).
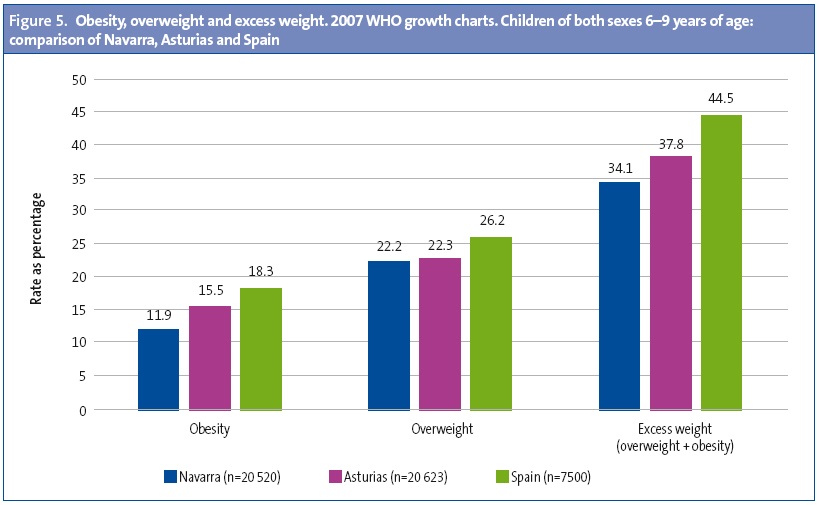
In children 6 to 9 years of age, the prevalence of overweight and obesity in Asturias found in this study, which applied the same criteria as the nationwide ALADINO study,11 is lower than in this latter study, but higher than the prevalence found in the study conducted in Navarra (Figure 5)
In terms of trends, while the study results are not homogeneous, we did not find significant differences between our current study and the study conducted in Asturias in 2006.
Studies based on population surveys carry significant biases,12 as was the case of the study conducted in Asturias in 291 children 9 and 10 years of age, in which the percentage of obesity was 6.02% based on the survey data and 15.06% based on the data from staff conducting examinations, with the latter figure being closer to the 16.9% of obesity at 10 years found in our study.
We ought to highlight the considerable differences observed not only between health care areas, but also between basic zones within single areas, with the exception of area I (with the highest rates) and area VI (with low and homogeneous rates) (Table 5).
The ranking of the 68 basic health areas under study by prevalence of excess weight, obesity and severe obesity showed that 8 health care centres hold the highest prevalences for all the parameters under study, and some centres have poor rates in only one of the parameters studied, possibly reflecting pockets of the population with specific characteristics.
Of the 68 basic health zones under study, 34 had a prevalence of excess weight above the mean prevalence for Asturias (statistically significant difference), 38 were above the mean for obesity, and 31 for severe obesity; while 24 basic health zones had excess weight rates below the mean prevalence for Asturias, 27 had lower obesity rates, and 25 had lower severe obesity rates. The cause for these sizeable differences has yet to be investigated.
Conclusions
The primary care medical records electronic database (OMI-AP) allows the calculation of the prevalence of childhood obesity and other growth disorders in Asturias.
The high prevalences of overweight and obesity appear at early ages (in the third year of life). The differences in the rates of overweight and obesity are considerable not only between health care areas but also between the basic health zones in a single area, some of which have rates lower or equal to the countries with the lowest prevalence rates in the COSI study.14 Knowing these differences will allow us to specifically design and prioritise interventions in the paediatric population of Asturias.
The specific data for each paediatrician and its comparison with the overall data can guide physicians and nurses in their approach to nutritional disorders in their caseloads.
ACKNOWLEDGMENTS
We want to thank all paediatricians and nurses in the health care centres of Asturias for the quality of their records and the high health coverage of the paediatric population. We want to thank the Central Administration of the SESPA for the access to their database. We are grateful to the Asociación Española de Pediatría de Atención Primaria (Spanish Association of Primary Care Paediatrics) for funding this research, and to the Asociación Asturiana de Pediatría de Atención Primaria (Asturias Association of Primary Care Paediatrics) for their help.
CONFLICTS OF INTEREST
This study has been supported by the Spanish Association of Primary Care Paediatrics (Asociación Española de Pediatría de Atención Primaria [AEPap]) and has received no other funding. The authors have no conflicts of interest to declare
ABBREVIATIONS: AC: autonomous community; BMI: body mass index; CI: confidence interval; CIAS: physician identification code; IASO: International Association for the Study of Obesity; PC: Primary Care; SD: standard deviation; SESPA: Department of Health of the Principality of Asturias; TIS: tarjeta individual sanitaria; WHO: World Health Organization.
REFERENCES
- Pembrey ME. Time to take epigenetic inheritance seriously. Eur J Human Genet. 2002;10:669-71.
- Kaati G, Bygren LO, Pembrey ME, Sjöström M. Transgenerational response to nutrition, early life circumstances and longevity. Eur J Human Genet. 2007;15:784-90.
- Currie C, Roberts C, Morgan A, Smith R, Settertobulte W, Samdal O, et al. (eds.). Young people’s health in context. Health behavior in school-aged children (HBSC) study: international report from the 2001/2002 survey.En: Organización Mundial de la Salud [en línea] [consultado el 11/03/2015]. Disponible enwww.euro.who.int/__data/assets/pdf_file/0008/110231/e82923.pdf
- Ferrández A, Baguer L, Labarta Jl, Labena C, Mayayo E, Puba B, et al. Longitudinal study of normal Spanish children from birth to adulthood (anthropometric, pubertal, radiological and intellectual data. Pediatr Endocr Rev. 2005;2:423-559.
- Cole TJ, Flegal KM, Nicholls D, Jackson AA. Body mass index to define thinness in children and adolescent: International survey. BJM. 2007;335:194.
- WHO multicentre growth reference study group. The WHO child growth standards, length/height-for-age, weight-for-age, weight-for length, weight for height, body mass index-for-age: Methods and development. Ginebra: Organización Mundial de la Salud; 2006.
- De Onis M, Onyango AW, Borghi E, Siyam A, Nishida C, Siekmann J. Development of a WHO growth reference for school-aged children and adolescents. Bull WHO. 2007;85:660-7.
- De Onis M, Blössner M, Borghin E. Global prevalence and trends of overweight and obesity among preschool children. Am J Clin Nutr. 2010;92:1257-64.
- Shields M, Tremblay MS. Canadian childhood obesity estimates based on WHO, IOTF and CDC cut-points. Int J Pediatr Obes. 2010;5:265-73.
- De Onis M, Lobstein T. Defining obesity risk status in the general childhood population: Which cut-offs should we use? Inter J Pediatr Obes. 2010;5:458-60.
- AESAN. Estudio de prevalencia de la obesidad infantil – Estudio ALADINO (Alimentación, Actividad física, Desarrollo Infantil y Obesidad). En: Ministerio de Sanidad, Servicios Sociales e Igualdad [en línea] [actualizado el 18/06/2013, consultado el 11/03/2015]. Disponible enwww.naos.aesan.msps.es/naos/investigacion/aladino/
- Amigo I, Busto R, Pena E, Fernández C. Prevalencia de sobrepeso y obesidad en los niños de 9 y 10 años del Principado de Asturias: el sesgo de la valoración de los padres. An Pediatr (Barc). 2013;79:307-11.
- Wijnhoven TMA. WHO European Childhood Obesity Surveillance Initiative 2008: weight, height and body mass index in 6-9-year-old children. Pediatr Obes. 2013;8:79-97.
APPENDIX 1
APPENDIX 2
Comments
This article has no comments yet.