
Vol. 19 - Num. 75
Original Papers
Association between perceived oral fluid intake and urine volume in a healthy population
Concepción Mir Perellóa, Concepción Sáez-Torres Barrosob, Dolores Rodrigo Jiméneza, Adrián Rodríguez Rodríguezb, Javier Lumbreras Fernándeza, Guiem Frontera Juanc, Joan Figuerola Muleta, Félix Grases Freixedasb
aServicio de Pediatría. Hospital Universitari Son Espases. Palma de Mallorca. España.
bLaboratorio de Investigación en Litiasis Renal. Instituto Universitario de Investigación en Ciencias de la Salud (IUNICS-IdISPa). Universidad de las Islas Baleares. Palma de Mallorca. España.
cUnidad de Investigación. Hospital Universitari Son Espases. Palma de Mallorca. España.
Correspondence: C Mir. E-mail: mariac.mir@ssib.es
Reference of this article: Mir Perelló C, Sáez-Torres Barroso C, Rodrigo Jiménez D, Rodríguez Rodríguez A, Lumbreras Fernández J, Frontera Juan G, et al. Association between perceived oral fluid intake and urine volume in a healthy population. Rev Pediatr Aten Primaria. 2017;19:223-9.
Published in Internet: 05-07-2017 - Visits: 114628
Abstract
Introduction: a low urine volume is a main etiological factor for renal lithiasis (< 1 ml/kg/h). It is commonly assumed that children who report a high fluid intake have a protective urine volume. The purpose of the present study is to assess the habit of fluid intake in healthy schoolchildren and to evaluate its relation with the urinary volume.
Methods: eighty-four healthy schoolchildren (5-17 years) were asked to categorize their usual fluid intake amount by choosing one of the three options: “low”, “normal” or “high” fluid intake. The usual consumed types of beverage were also recorded. Twenty-four-hour urine volume was measured in each child. The results of the questionnaire were compared to that from the urine samples.
Results: a “low” fluid intake was referred by 23% of children, a “normal” fluid intake by 57% and a “high” fluid intake by 21%. Diuresis values > 1 ml/kg/h were observed in 39% of children (that is: 38.9% of the “low intake” group, 63% of the “normal intake” group and 73.7% of the “high intake” group). Among “normal” and “high” intake groups, a urinary output < 1 ml/kg/h was found in 56% of children.
Conclusions: a majority of the studied children did not reach the minimum recommended diuresis to prevent urinary lithiasis, even among children who report a high intake of fluids. Strategies aimed at increasing water intake by children population should be highly encouraged.
Keywords
● Drinking ● Nutrition ● Renal lithiasis ● Urine volumeINTRODUCTION
Adequate fluid intake is essential to maintaining the internal environment. Increased water intake has been associated with decreased progression in many diseases of renal1,2 as well as extrarenal aetiology.3,4 However, the disease for which there is the most scientific evidence of the therapeutic effects of increased water intake is renal lithiasis.5,6 Although lithiasis is less frequent in the paediatric age group compared to adults,7,8 the medical literature shows that this disease is occurring at increasingly early ages and with severe presentations,9,10 especially in adolescents.11,12
Kidney stone formation is the final consequence of an imbalance between the substances that promote and inhibit crystal formation usually found in urine.11,13 The most important risk factor for crystal formation is the degree of supersaturation. The degree of supersaturation of different substances in urine depends on the total amount of the substance14 and, more importantly, on urine volume.15 Thus, a low fluid intake constitutes an independent risk factor for any type of lithiasis because it increases urine concentration14 and parenchymal transit time.15,16
The guidelines regarding adequate urine outputs that can protect against the formation of the most frequent types of kidney stones in the paediatric population vary from one publication to another and range between 0.8 and 1.4 ml/kg/h; and the most widely accepted threshold is 1 ml/kg/h.7,17 Generally speaking, the recommended urine output by age group is of 750 ml/24 hours in infants, 1000 ml/24 hours in children aged less than 5 years, 1500 ml/24 hour in children aged 5 to 10 years and more than 2000 ml/24 hours in individuals aged more than 10 years.18 Conversely, urine output values of less than 0.5 ml/kg/h (considered to be in the range of oliguria) are associated with a very high risk of urine supersaturation.19
An intake of 1.5 to 2 l/m2/day of water is usually sufficient to achieve the recommended urine output, although this amount changes depending on the circumstances of each child and should be increased during periods in which water losses are greater. Fluids usually account for 80% of the total water intake, while the remaining 20% comes from solid food sources.19 The intake of fluids motivated by the sensation of thirst is an effective mechanism toward the prevention of dehydration, but is not sufficient in itself to maintain adequate hydration. The latter requires additional fluid consumption, which depends on an individual’s will and can become a habit if sustained through time. A key factor in establishing this habit is ensuring that the child (or the child’s family, in the case of younger children) is aware of the amount of fluids that the child needs to drink based on his or her needs or daily activities.
Our study was based on the hypothesis that the subjective perception of children or their families that the child consumes an adequate amount of fluids does not always correspond to safe urine output values that can prevent renal lithiasis. Therefore, the primary objective of the study was to assess whether the habitual fluid intake reported in the history taking corresponded to urine output values greater or lesser than 1 ml/kg/hour measured in a 24-hour urine sample. The secondary objectives were to describe the number of children that reported each pattern of fluid intake along with their urine output by age and sex. We also sought to determine the drinks that are usually consumed by the study sample.
MATERIALS AND METHODS
We conducted an observational cross-sectional descriptive study in a sample of healthy children aged 5 to 17 years enrolled in several schools in Majorca (Balearic Islands, Spain) while school was in session between March 2014 and February 2015. We excluded children with acute or chronic illness or that were undergoing pharmacological treatment at the time of the study. We asked participants not to deviate from their usual dietary and physical activity habits. We obtained the informed consent of the parents or guardians of the students. The study was approved by the Ethics Committee of the Balearic Islands (IB 3152/16 PI).
We collected data for the following variables: age, sex, perceived fluid intake, and 24-hour urine volume.
We established the habitual fluid intake of each child through history taking; intake was self-reported by the participant when he or she was aged more than 13 years and by the family for younger children. We classified children into three categories: “drinks small amounts” (less than one full glass during meals and only occasionally between meals), “drinks a normal amount” (one glass during meals and some more between meals) or “drinks large amounts” (refills the glass during meals and has several glasses between meals).
We asked children to collect their urine in a bottle provided for the purpose for a total of 24 hours, explaining that they needed to discard the first morning urine on the day of collection, and include the first morning urine of the following morning. We measured the 24-hour urine volume and calculated the urine output, expressing it in ml/kg/h. We only accepted samples with a creatinine excretion rate of 15 to 25 mg/kg/24 h as a criteria of correct sample collection and based on the cut-off points for the European population described by Remer.20 We calculated the overall result for the entire sample and divided the values into four groups (output > 1 ml/kg/h, between 0.8 and 1 ml/kg/h, between 0.5 and 0.8 ml/kg/h and < 0.5 ml/kg/h). We considered urine outputs of 1 ml/kg/h or greater a protective factor.
We calculated the overall results for the entire sample and also established the distribution by sex and by age, dividing the latter into three groups: 5-8 years, 9-12 years and 13-17 years (adolescents). We conducted a descriptive analysis of the variables under study, calculating measures of central tendency and dispersion appropriate to the distribution of each variable: mean and standard deviation for normally distributed variables, and median and interquartile range otherwise. For categorical variables (low, normal or high intake, sex, and age groups) we calculated proportions and compared groups by means of the χ2 test. We used the statistical software SPSS® for Windows® version 2.0. We defined statistical significance as a p-value of less than 0.05.
RESULTS
We studied a total of 84 children (48 male and 36 female): 13 children aged 5 to 8 years, 36 aged 9 to 12 years, and 35 aged 13 to 17 years (adolescents). The mean age was 11.5 years.
Table 1 shows the results of the perceived habitual fluid intake in terms of amount (low, normal or high) distributed by sex. We found statistically significant differences between the different age groups (P < .05) (Table 2). The median 24-hour urine output in the total sample under study was 0.93 ml/kg/h. Table 1 shows its distribution by sex. Its distribution by age group was 0.92 ml/kg/h in children aged 5 to 8 years, 0.97 ml/kg/h in children aged 9 to 12 years and 0.93 ml/kg/h in children aged 13 to 17 years, with no statistically significant differences between these groups.
| Table 1. Mean age, urine output and perceived fluid intake for the overall sample and by sex. The percentage of the total is shown in parentheses |
||||
|---|---|---|---|---|
| Male (n = 48) | Female (n = 36) | Total (n = 84) | ||
| Age (mean) | 11.6 years | 11.3 years | 11.5 years | |
| Urine output | 0.93 ml/kg/h | 0.94 ml/kg/h | 0.93 ml/kg/h | |
| Perceived fluid intake | Low | 9 (19%) | 10 (28%) | 19 (23%) |
| Normal | 27 (56%) | 20 (55%) | 47 (56%) | |
| High | 12 (25%) | 6 (17%) | 18 (21%) | |

| Table 2. Perceived fluid intake by age group. The percentage of the total number of children in the given age group is shown in parentheses |
|||
|---|---|---|---|
| Perceived fluid intake | 5-8 years (n=14) | 9-12 years (n=36) | 13-17 years (n=34) |
| Low | 5 (35%) | 7 (20%) | 7 (20%) |
| Normal | 7 (50%) | 21 (58%) | 19 (56%) |
| High | 2 (15%) | 8 (22%) | 8 (24%) |

Of all the children under study, 33 (39%) had urine output values of 1 ml/kg/h or greater, 20 (24%) had values between 0.8 and 1 ml/kg/h, 25 (29%) values between 0.8 and 0.5 ml/kg/h, and 5 (6%) values of less than 0.5 ml/kg/h. Table 3 shows the distribution of urine output values by age group.
| Table 3. 24-hour urine output (in ml/kg/h) by age group. The percentage of the total number of children in the given age group is shown in parentheses |
||||
|---|---|---|---|---|
| 5-8 years (n = 14) | 9-12 years (n = 36) | 13-17 years (n = 34) | Total (n = 84) | |
| < 0.5 ml/kg/h | 0 (0%) | 2 (5%) | 5 (15%) | 7 (8%) |
| 0.5-0.8 ml/kg/h | 3 (21%) | 10 (28%) | 7 (20%) | 20 (24%) |
| 0.8-1 ml/kg/h | 7 (50%) | 10 (28%) | 12 (35%) | 29 (35%) |
| > 1 ml/kg/h | 4(29%) | 14 (29%) | 10 (30%) | 28 (33%) |
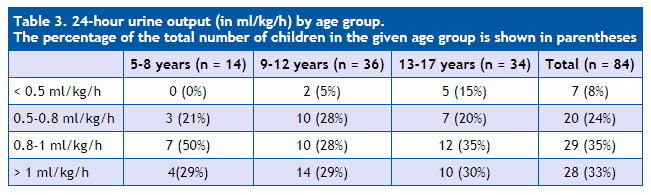
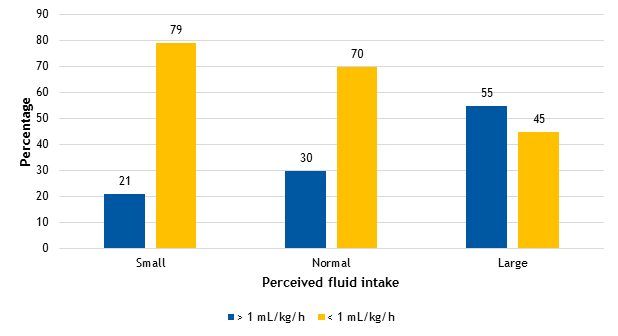
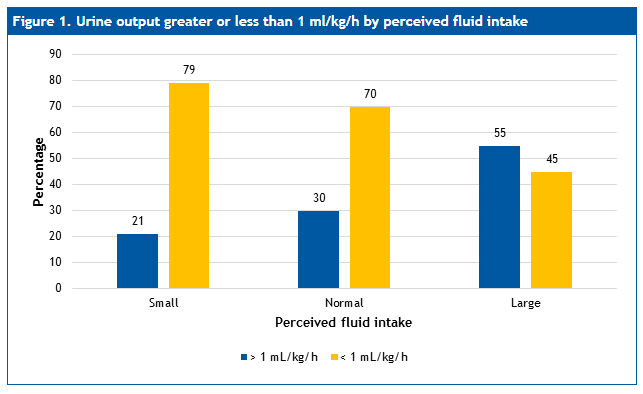
Figure 1 shows the urine output results (greater or less than 1 ml/kg/h in 24 h) based on the reported habitual fluid intake. We did not find statistically significant differences in the median urine output, which was of 0.91 ml/kg/h (interquartile range [IQR]: 0.76-1.01), 0.91 ml/kg/h (IQR: 0.76-1.17), and 1.1 ml/kg/h (IQR: 0.84-1.33) in the groups with perceived “low”, “normal” or “high” habitual fluid intake, respectively. We found that 55% (17/84) of participants had urine outputs of more than 1 ml/kg/h in the group that reported a high fluid intake, compared to 30% (46/84) in the group that reported a normal intake and 20% (25/84) in the low-intake group.
| Figure 1. Urine output greater or less than 1 ml/kg/h by perceived fluid intake |
|---|
 |
DISCUSSION
In our study, we found a greater percentage of children with a urine volume considered adequate in the group that reported drinking larger amounts of fluid and vice versa. Nevertheless, and supporting our working hypothesis, we found a large number of cases in which this association did not hold.
Patients frequently err in believing that their dietary habits are healthy (in this instance, their reported fluid intake). Although this fact is manifest in clinical practice, no studies have investigated it in the paediatric population. The findings of our study evince that the information provided by patients on their fluid intake habits often does not correspond to the presence of healthy urine output values. Thus, we noticed that most children that reported drinking “normal amounts” of fluid had urine outputs of less than 1 ml/kg/h, which was also the case in 1 out of every 2 children that reported a high intake. We ought to underscore that we conducted our study in a healthy population (without acute or chronic illness at the time of sample collection) and in the absence of extreme weather conditions. In this same population, in which we found such a high proportion of low urine volumes, the concurrence of additional factors associated with increases in extrarenal water loss (such as fever, vomiting, diarrhoea, or severe heat) or conditions that promote supersaturation and urine stasis (nutritional imbalance, immobilization, etc) will considerably increase the risk of crystal formation in urine.
We did not find differences in urine output values in our analysis by sex. Thus, the widespread belief that boys drink more (which is also supported in our study by the greater percentage of male participants that reported drinking “a lot of water”) was not manifested in our results through the finding of larger urine volumes. The study design did not allow us to determine whether this is due to differences in what boys and girls consider to be a “normal amount” of water intake or boys actually drinking more, but our results are also affected by greater insensible water losses in boys due to a higher level of physical activity.
When it came to the different age groups under study, the results showed lesser urine outputs in the adolescent group, which also had the most cases of extremely low output (< 0.5 ml/kg/h). This may reflect the current situation in the population and be one of the factors that is promoting the increase in the incidence of lithiasis in young individuals. The medical literature indicates that lithiasis in adolescence is strongly influenced by environmental factors, such as low urine volumes,17 contrary to what happens in younger patients, in who there is a predominance of metabolic abnormalities in urine (especially in children aged less than 10 years). Consequently, the need for pharmacological treatment is more frequent in younger children, while in adolescents there are more cases in which dietary changes alone suffice to prevent recurrence.17
Among the dietary changes associated to the increased incidence of lithiasis in adolescents, we must pay especial attention to fluid intake habits, as the observed decrease in urinary output may be due to the development of dietary patterns including a reduced water intake,21 even if, as we found in our study, it is not perceived as such by the adolescent.
When it comes to lithogenic risk, it is important to take into account both the amount and the type of fluid that is consumed. Water should be the main drink consumed by the population, as recommended by the World Health Organization.18 Other fluids, such as milk, are essential to the growth and development of the paediatric population. On the other hand, natural juices, which contribute substances that inhibit urine crystal formation, such as citrate, and other healthy micronutrients, are also recommended.22 In adolescence, consumption of water, milk and natural juices is displaced by the increased consumption of other beverages23 (chief of which are colas and soft drinks), whose high phosphorus and oxalate contents have been associated with an increased risk of calculus formation.3,21,24,25
CONCLUSIONS
In most of the children under study, fluid intake did not result in adequate urine output, even in those that reported drinking large volumes.
Our findings indicate that education on healthy fluid intake habits for each age group and the implementation of strategies aimed at increasing water intake are needed for the primary and secondary prevention of renal lithiasis. In this regard, primary care paediatricians play an essential role, as they have the opportunity of acting during a period in life that is key in the development of habits, and of detecting patients at risk as well as risk situations that can be corrected from an early age. In patients who need to maintain a high urine volume, adherence to hydration recommendations must be assessed by comparison with objective measurements of urine output.
CONFLICTS OF INTEREST
The authors have no conflicts of interest to declare in relation to the preparation and publication of this article.
REFERENCES
- Nagao, S, Nishii, K, Katsuyama, M. Increased water intake decreases progression of polycystic kidney disease in the PCK rat. J Am Soc Nephrol. 2006;17:2220-7.
- Wang CJ, Creed C, Winklhofer FT. Water prescription in autosomal dominant polycystic kidney disease: a pilot study. Clin J Am Soc Nephrol. 2011;6:192-7.
- Vitoria I, Dalmau J. El agua: bebida recomendable para una adecuada nutrición en la infancia. Acta Pediatr Esp. 2011;69:259-66.
- Manz F, Wentz A. The importance of good hydration for the prevention of chronic diseases. Nutr Rev. 2005;63:2S-5S.
- Hernandez JD, Ellison JS, Lendvay TS. Current trends, evaluation, and management of pediatric nephrolithiasis. JAMA Pediatr. 2015;169:964-70.
- Fink H, Wilt T, Eidman K, Garimella P, MacDonald R, Monga M, et al. Medical management to prevent recurrent nephrolithiasis in adults: a systematic review for an American College of Physicians Clinical Guideline. Ann Inter Med. 2013;158:535-43.
- Penido MG, Tavares Mde S. Pediatric primary urolithiasis: symptoms, medical management and prevention strategies. World J Nephrol. 2015;4:444-54.
- Sarica K. Pediatric urolithiasis: etiology, specific pathogenesis and medical treatment. Urol Res. 2006;34:96-101.
- Valentini RP, Lakshmanan Y. Nephrolithiasis in children. Adv Chronic Kidney Dis. 2011;18:370-5.
- Van Dervoort K, Wiesen J, Frank R, Vento S, Crosby V, Chandra M, Trachtman H. Urolithiasis in pediatric patients: a single center study of incidence, clinical presentation and outcome. J Urol. 2007;177:2300-5.
- Alpay H, Ozen A, Gokce I. N. Clinical and metabolic features of urolithiasis and microlithiasis in children. Pediatr Nephrol. 2009;24:2203-9.
- Tasian GE, Copelovitch L. Evaluation and medical management of kidney stones in children. J Urol. 2014;192:1329-36.
- Daudon M, Hennequin C, Boujelben G, Lacour B, Jungers P. Serial crystalluria determination and the risk of recurrence in calcium stone formers. Kidney Int. 2005;67:1934-43.
- Cameron M, Sakhaee K, Moe O. Nephrolithiasis in children. Pediatr Nephrol. 2005;20:1587-92.
- Borghi L, Meschi T, Amato F, Briganti A, Novarini A, Giannini A. Urinary volume, water and recurrences in idiopathic calcium nephrolithiasis: a 5-year randomized prospective study. J Urol. 1996;155:839-43.
- Anastasio P, Cirillo M, Spitali L. Level of hydration and renal function in healthy humans. Kidney Int. 2001;60:748-75.
- Cambareri GM, Kovacevic L, Bayne AP, Giel D, Corbett S, Schurtz E, et al. National multi-institutional cooperative on urolithiasis in children: age is a significant predictor of urine abnormalities. J Pediatr Urol. 2015;11:218-23.
- Guidelines for drinking-water quality: incorporating first addendum. Vol. 1, Recommendations, 3.ª ed. In: World Health Organization [online] [accesed 05/07/2017]. Available at www.who.int/water_sanitation_health/dwq/gdwq0506begin.pdf
- Taylor E, Fung T, Curhan G. DASH-style diet associates with reduced risk for kidney stones. J Am Soc Nephrol. 2009;20:2253-9.
- Remer T, Neubert A, Maser-Gluth C. Anthropometry-based reference values for 24-h urinary creatinine excretion during growth and their use in endocrine and nutritional research. Am J Clin Nutr 2002;75:561-9.
- Comité de Nutrición de la Asociación Española de Pediatría. Consumo de zumos de frutas y de bebidas refrescantes por niños y adolescentes en España. Implicaciones para la salud de su mal uso y abuso. An Pediatr (Barc). 2003;58:584-93.
- Meschi T, Maggiore U, Fiaccadori E, Schianchi T, Bosi S, Adorni G, et al. The effect of fruits and vegetables on urinary stone risk factors. Kidney Int. 2004;66:2402-10.
- Prezioso D, Strazzullo P, Lotti T, Bianchi G, Borghi L, Caione P, et al. Dietary treatment of urinary risk factors for renal stone formation. A review of CLU Working Group. Arch Ital Urol Androl. 2015;87:105-20.
- Rodgers A. Effect of cola consumption on urinary biochemical and physicochemical risk factors associated with calcium oxalate urolithiasis. Urol Res. 1999;27:77-81.
- Vitoria I, Dalmau J, Castells X, Calatayud O, Arias T. Fosfatos en colas y otras bebidas refrescantes. Riesgo de hipocalcemia en la infancia. An Pediatr (Barc). 2002;56:18.