
Vol. 27 - Num. 106
Original Papers
Immigration in Spain. Psychosocial risk factors
Sara Monzón Calvoa, José Ignacio Pérez Candásb
aPediatra. CS Los Yébenes. Madrid. España.
bPediatra. Coordinador del Grupo de Trabajo de Pediatría Social y Comunitaria de la AEPap.
Correspondence: S Monzón. E-mail: sara.monzon@salud.madrid.org
Reference of this article: Monzón Calvo S, Pérez Candás JI. Immigration in Spain. Psychosocial risk factors . Rev Pediatr Aten Primaria. 2025;27:125-36. https://doi.org/10.60147/6a59767f
Published in Internet: 13-05-2025 - Visits: 32316
Abstract
Introduction: WHO defines health as “a state of complete physical, mental and social well-being and not merely the absence of disease or infirmity.” The PAHO describes social determinants of health as “the circumstances in which people are born, grow up, work, live and age, including the forces and systems that influence everyday life.” Migrants face the impact of various psychosocial factors as they leave their country and adapt to new environments. The aim of this study was to analyze the distribution of migrants in Spain and to identify risk factors in this population in order to improve their health in the medium and long term.
Material and methods: we conducted a retrospective observational study of the population residing in Spain during 2018 and 2022 (the interval in which the largest number of data were collected). We retrieved data from the National Institute of Statistics, the Crime Statistics Portal of the Ministry of the Interior and the Women’s Institute of the Ministry of Equality.
Results: we found lower educational attainment, poorer housing conditions and greater poverty in the immigrant population. Immigrants also experienced more difficulties accessing health care compared to the Spanish population.
Conclusions: policies need to be implemented to reduce these inequities.
Keywords
● Families ● Immigration ● Social riskINTRODUCTION
According to the World Health Organization (WHO), health is “a state of complete physical, mental and social well-being and not merely the absence of disease or infirmity.”1 The Pan American Health Organization (PAHO) defines social determinants of health (SDHs) as “the circumstances in which people are born, grow, work, live, and age, and the wider set of forces and systems shaping the conditions of daily life.”2 Risk factors, such as family conflict, migration and poverty, have a deleterious impact on health, while protective factors, such as education and access to health care, help mitigate them.3 Risk factors are common in the immigrant population, especially in children, who are at increased risk of mental health disorders.4,5. The aim of our study was to analyze the distribution of immigrants in Spain and the risk factors in this population in order to improve long-term health outcomes.
MATERIAL AND METHODS
We conducted a retrospective observational study using demographic data for years 2018 and 2022 in Spain obtained from the Instituto Nacional de Estadística (INE, National Institute of Statistics),6 the Crime Statistics Portal of the Ministry of the Interior of Spain7 and the Women’s Institute of the Ministry of Equality of Spain.8 We analyzed migration trends, the distribution of alien residents, birth, fertility and mortality rates, employment, educational attainment, housing, xenophobia, gender violence, alcohol use, health care access and pediatric mental health. We compared these variables in the immigrant and Spanish national populations, using the Microsoft Excel software and the odds ratio (OR) to analyze associations and the significance of the results.
RESULTS AND DISCUSSION
Given the large amount of quantitative data on migration between 2018 and 2022 and its characteristics, which will also be discussed, we decided to combine the results and discussion sections to facilitate understanding.
- Immigrants in 2018: 4 734 691 (10.1% of the total population of 46 722 960).
- Immigrants in 2022: 5 542 932 (2 764 718 female and 2 778 214 male), accounting for 11.7% of the total population of 47 475 420. Chiefly residing in Catalonia, Community of Madrid and Valencian Community.
- Sixteen percent aged less than 16 years: 773 575 in 2018 (10% of total population < 16 years) and 865 716 in 2022 (11% of total population < 16 years).
In 2018, the mean age of Spanish nationals was 44 years compared to 36 years in the immigrant population. In 2022, the mean ages were 45 and 37 years, respectively.
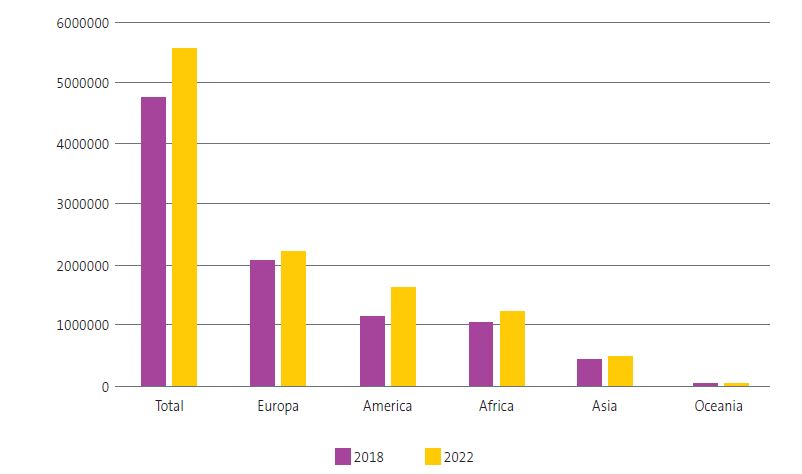
Region of origin (Figure 1):
| Figure 1. Continent of origin of the foreign population in Spain in years 2018 and 2022 |
|---|
 |

Europe
2018: 2 061 035; 2022: 2 205 961. Increase of 7%. Predominantly from Romania (2018: 676 005; 2022: 627 478).
America
2018: 1 162 350; 2022: 1 618 989. Increase of 39%. Predominantly from Colombia (2018: 165 918; 2022: 314 679).
Africa
2018: 1 066 029; 2022: 1 217 706. Increase of 14%. Predominantly from Morocco (2018: 770 523; 2022: 883 243).
Asia
2018: 440 272; 2022: 493 065. Increase of 12%. Predominantly from China (2018: 215 970; 2022: 223 999).
Oceania
2018: 3305; 2022: 3580. Increase of 8%. Predominantly from Australia (2018: 2419; 2022: 2692).
In Spain, most immigrants are young people from Morocco and Latin America (primarily Colombia), with no significant differences based on sex.
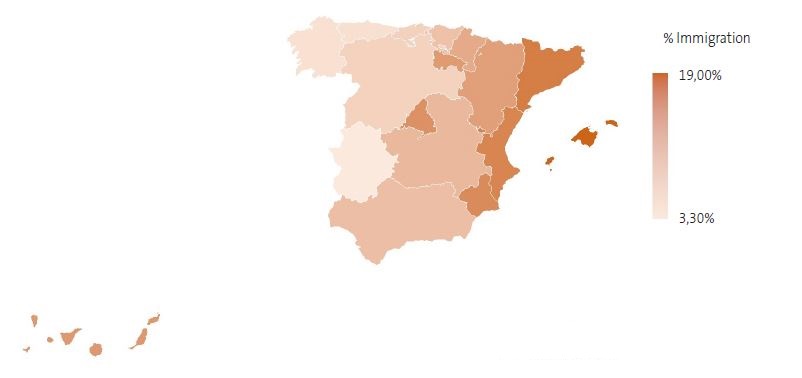
Distribution by autonomous community (Figures 2 and 3):
| Figure 2. Map showing the percentage distribution of the foreign population out of the total population in Spain by autonomous community in 2022 |
|---|
 |

| Figure 3. Percentage distribution by nationality of the foreign population in each autonomous community in Spain in 2022 |
|---|
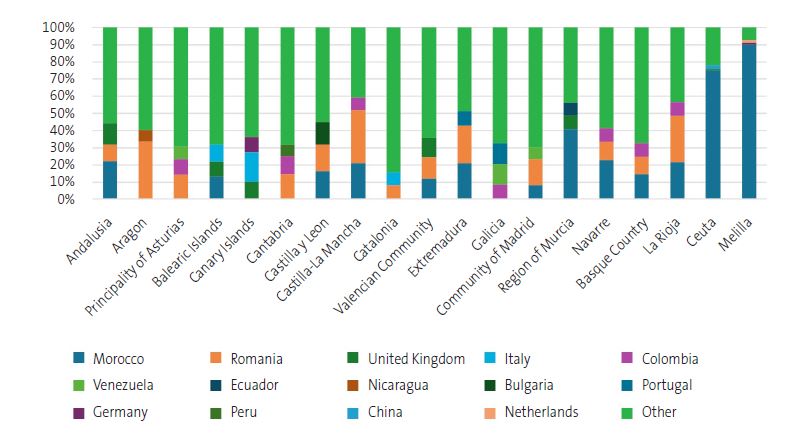 |

- Catalonia: 1 271 810 in 2022, 16.3% of total population. Increase of 17.5% since 2018 (1 082 099). Predominant countries of origin: Morocco (235 278), Romania (86 528) and Italia (76 826).
- Community of Madrid: 949 969 in 2022, 14% of total population. Increase of 15% since 2018 (826 456). Predominant countries of origin: Romania (144 694), Morocco (77 369) and Venezuela (67 710).
- Valencian Community: 784 469 in 2022, 15.4% of total population. Increase of 18% since 2018 (664 921). Predominant countries of origin: Romania (98 273), Morocco (91 375) and United Kingdom (87 699).
- Andalusia: 741 378 in 2022, 8.7% of total population. Increase of 19.3% since 2018 (621 396). Predominant countries of origin: Morocco (163 585), United Kingdom (92 180) and Romania (73 010).
- Canary Islands: 288 489 in 2022, 13.2% of total population. Increase of 11% since 2018 (260 191). Predominant countries of origin: Italy (49 987), United Kingdom (29 631) and Germany (25 397).
- Region of Murcia: 226 765 in 2022, 14.8% of total population. Increase of 12% since 2018 (202 432). Predominant countries of origin: Morocco (92 380), United Kingdom (17 562) and Ecuador (16 623).
- Balearic Islands: 222 017 in 2022, 19% of total population. Increase of 15.1% since 2018 (192 861). Predominant countries of origin: Morocco (28 972), Italy (22 099) and United Kingdom (19 569).
- Castilla-La Mancha: 193 475 in 2022, 9.4% of total population. Increase of 18.1% since 2018 (163 820). Predominant countries of origin: Romania (60 132), Morocco (40 470) and Colombia (13 873).
- Basque Country: 184 617 in 2022, 8.4% of total population. Increase of 21.8% since 2018 (151 519). Predominant countries of origin: Morocco (26 862), Romania (18 319) and Colombia (15 192).
- Aragon: 164 762 in 2022, 12.4% of total population. Increase of 20.5% since 2018 (136 692). Predominant countries of origin: Romania (48 129), Morocco (22 464) and Nicaragua (9 338).
- Castilla and Leon: 146 655 (6.2% of total population) in 2022. Increase of 18.7% since 2018. Predominant countries of origin: Morocco, Romania, Bulgaria.
- Galicia: 118 740 (4.4%) in 2022. Increase of 28.3%. Predominant countries of origin: Portugal, Venezuela, Colombia.
- Navarre: 73 475 (11%) in 2022. Increase of 25%. Predominant countries of origin: Morocco, Romania, Colombia.
- Asturias: 45 630 (4.5%) in 2022. Increase of 13.8%. Predominant countries of origin: Romania, Colombia, Venezuela.
- La Rioja: 41 755 (13%) in 2022. Increase of 17.1%. Predominant countries of origin: Romania, Morocco, Colombia.
- Cantabria: 37 203 (6.4%) in 2022. Increase of 21.3%. Predominant countries of origin: Romania, Colombia, Peru.
- Extremadura: 35 138 (3.3%) in 2022. Increase of 11%. Predominant countries of origin: Romania, Morocco, Portugal.
- Melilla: 11 675 (13.7%) in 2022. Decrease of 15.6%. Predominant countries of origin: Morocco, Netherlands, Germany.
- Ceuta: 5 842 (7%) in 2022. Increase of 19%. Predominant countries of origin: Morocco, China, United Kingdom.
Although Catalonia, the Community of Madrid and the Valencian Community have the largest percentages of immigrants, northern autonomous communities, such as Galicia, Navarre, Cantabria and Basque Country experienced the largest increases during this time interval.
We evaluated the SDH data recorded in 2022, the most recent year for which there were complete data.
Birth rate
The birth rate among Spanish nationals was 6.03 per 1000 inhabitants compared to 13.01 per 1000 inhabitants who were foreign nationals. Melilla had the highest birth rates: 8.43 in Spanish population and 23.97 in the immigrant population. Ceuta followed with 7.87 in the Spanish population and 22.98 in the immigrant population. Murcia had the highest birth rate among Spanish nationals (7.5) and Asturias the lowest (4.24). In the immigrant population, the birth rate was highest in Navarre (16.7) and lowest in the Canary Islands (8.76).
In 2022, the fertility rate was 29.21 in the Spanish national population compared to 42.00 in the immigrant population. The younger mean age of the immigrant population (37 years) compared to Spanish nationals (45 years) may have contributed to this difference. In Navarre, the mean age in the immigrant population is 34 years, compared to 42 years in the Canary Islands. We did not find significant differences in the number of male versus female immigrants in either of these autonomous communities (37 089 male and 36 386 female in Navarre; 142 565 male and 145 924 female in Canary Islands). Thus, age may be the factor that explains the observed difference in birth rates between the two regions.
Mortality rate
In 2022, there were 445 359 deaths in the Spanish national population (10.58 mortality rate) compared to 19 023 deaths in the foreign national population (3.43). The difference could be explained by the mean age: 45 years in the Spanish national population versus 37 in the immigrant population.
Number of children
At the national level, 59.19% of Spanish women have children compared to 62.5% of immigrant women. With respect to the age at which they start having children, we found that (Figure 4):
| Figure 4. Percentage of Spanish and foreign women in Spain with at least one child in 2022 by age group |
|---|
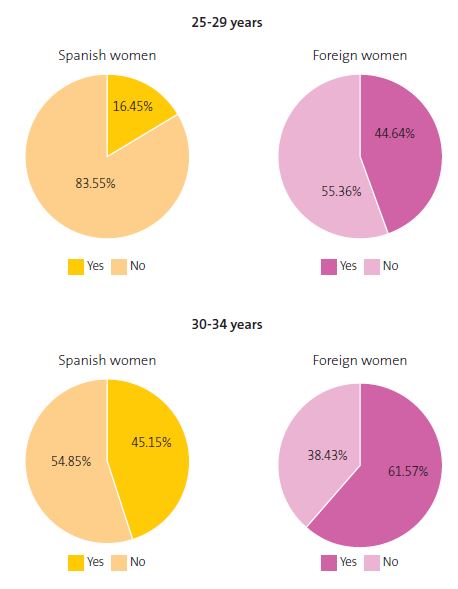 |

- In the group aged 25 to 29 years, 16.45% of Spanish women had children, compared to 44.64% of immigrant women (OR: 4.09; 95% CI: 2.12-7.92).
- In the group aged 30 and 34 years, 61.57% of immigrant women had children compared to 45.15% of Spanish women (OR: 1.94; 95% CI: 1.12-3.42).
Furthermore, 17.42% of immigrant women had three or more children, compared to 7.42% of Spanish women (OR: 2.63; 95% CI: 1.06-6.53). In the group aged 25 to 29 years, 9.5% of immigrant women already had three or more children compared to 0.85% of Spanish women in the same age group (OR: 12.24; 95% CI: 1.31-114.70).
Employment and unemployment rates
In 2022, the employment rate was 50.42% among Spanish inhabitants compared to 56.02% in the immigrant population, probably due to the younger age of the latter. The countries of origin with the highest employment rates were China (61.4%), Ecuador (59.7%) and Bolivia (55.5%). The the lowest employment rates corresponded to United Kingdom (23%), Colombia (33.6%) and Peru (37%).
The employment rate among male foreign nationals was 64%, compared to 48.65% for female foreign nationals (OR: 1.88; 95% CI: 1.07-3.31). We could not obtain data on the sex distribution by country of origin, but the employment rate in the population from other EU countries was 66.1% in men and 50.17% in women. For the population from countries outside the EU, it was 60.7% in men and 47% in women
The gender gap in employment rate was smaller among Spanish nationals (53.6% in men vs 45.52% in women).
Table 1 shows the labor force participation rate by age, sex and nationality. In the subset of residents from non-EU countries and Latin America, the rate was lower in women from (50%-60%) compared to men (90%).
| Table 1. Labor force participation rate by nationality, sex and age group | |||||
|---|---|---|---|---|---|
| Spanish | Foreign: EU | Foreign: rest of Europe | Foreign: Latin America | Foreign: Rest of the world | |
| Men | |||||
| 16-24 years | 33.96 | 55.93 | 48.89 | 47.81 | 61.14 |
| 25-34 years | 88.59 | 91.51 | 83.29 | 86.90 | 90.26 |
| 35-44 years | 93.72 | 95.95 | 90.34 | 88.20 | 91.80 |
| 45-54 years | 91.48 | 90.56 | 93.34 | 94.99 | 92.28 |
| ≥55 years | 32.83 | 38.45 | 17.70 | 58.45 | 60.29 |
| Women | |||||
| 16-24 years | 30.56 | 46.22 | 58.34 | 51.52 | 29.77 |
| 25-34 years | 86.32 | 83.42 | 74.06 | 81.81 | 52.46 |
| 35-44 years | 87.62 | 79.51 | 82.93 | 85.05 | 54.10 |
| 45-54 years | 81.52 | 78.47 | 68.97 | 86.99 | 64.52 |
| ≥55 years | 23.78 | 32.70 | 20.58 | 47.67 | 27.79 |
| Source: Instituto Nacional de Estadística. | |||||

The highest unemployment rate corresponded to Ceuta and Melilla, reaching 44% in the non-Spanish population.
Immigrant women had children between ages 25 and 29 years and a lower employment rate, which is indicative of difficulty affording child care expenses.
Educational attainment
Fifteen percent of Spanish nationals had only completed primary education, while 31.4% of foreign nationals had the same level of education (OR: 2.57; 95% CI: 2.56-2.58).
In addition, 31% of Spanish nationals had completed the secondary education level, compared to 23% of non-Spanish residents (OR: 1.50; 95% CI: 1.49-1.50).
Lastly, 32.5% of Spanish nationals had a university degree compared to 22.5% of foreign nationals (OR: 1.66; 95% CI: 1.66-1.67).
Overall, educational attainment was lower in the immigrant population, which hindered their access to skilled work.
By country of origin, the smallest proportions of individuals with a university-level education corresponded to Morocco, Romania and Dominican Republic, and the highest proportions to Venezuela, France and Argentina.
Average pay
In 2022, the mean gross monthly salary in Spain was €2431.87 in the group of Spanish nationals compared to €1835.69 in the group of foreign nationals. There are no data on salary by country of origin or sex.
Average income
The mean annual income in Spain was €20 229, compared to €14 545 in foreign residents from other EU countries and €11 146 in foreign residents from non-EU countries.
Economic security
According to the Living Conditions Survey (LCS) of 2022,9 32.3% of Spanish nationals and 64.5% of non-EU foreign nationals residing in Spain could not face unexpected expenses (OR: 3.81; 95% CI: 2.12-6.84).
Risk of poverty
The survey found that 16.2% of the Spanish population was at risk of poverty.10 In the population of foreign nationals residing in Spain, the percentage was 52.6% (OR: 5.74; 95% CI: 2.96-11.12).
The lower educational attainment and average income in the immigrant population explained the higher risk of poverty.
Housing
In 2022:
- 3% of Spanish families were homeowners, compared to 35.9% of families from other EU countries and 24.3% of families from non-EU countries. This difference was significant, with a higher homeownership rate in Spanish nationals (OR: 7.28; 95% CI: 3.84-13.80) and also in comparison to other nationalities (OR: 12.70; 95% CI: 6.48-24.87).
- 5% of Spanish nationals lived in rented homes, compared to 60.9% families from other EU countries (OR: 9.98; 95% CI: 4.95-20.10) and 70.8% of families from non-EU countries (OR: 15.53; 95% CI: 7.58-31.82).
Based on data from the LCS:
The proportion of families living in crowded conditions was 5.1% in the subset of Spanish residents,11 similar to the proportion in families from other countries in the European Union (6.1%). However, the percentage increased significantly in families from other countries (17.7%), with an OR of 4.00 (95% CI: 1.43-11.19).
In 2020, families from non-EU countries were significantly more likely to live in substandard housing 12 (31.2%, OR: 2.04; 95% CI: 1.05-3.95) compared to Spanish families (18.2%). This was also the case of families from other EU countries (31%, OR: 2.02; 95% CI: 1.04-3.92).
The percentage of immigrants who lived in substandard housing was greater compared to Spanish nationals.
Victims of xenophobia
In 2022, there were 892 documented hate crimes due to xenophobia. Victims were most frequently Spanish (327), Moroccan (144), Colombian (43) and Senegalese (39). The risk was highest for individuals from Senegal (OR: 60; 95% CI: 43.05-84.04) compared to Morocco (OR: 20.97; 95% CI: 17.24-25.52) or Colombia (OR: 17.60; 95% CI: 12.80-17.60). All the differences were statistically significant.
The distribution by autonomous community was (Figures 5 and 6):
| Figure 5. Map showing the frequency distribution of victims of xenophobia by autonomous community in Spain in 2022 |
|---|
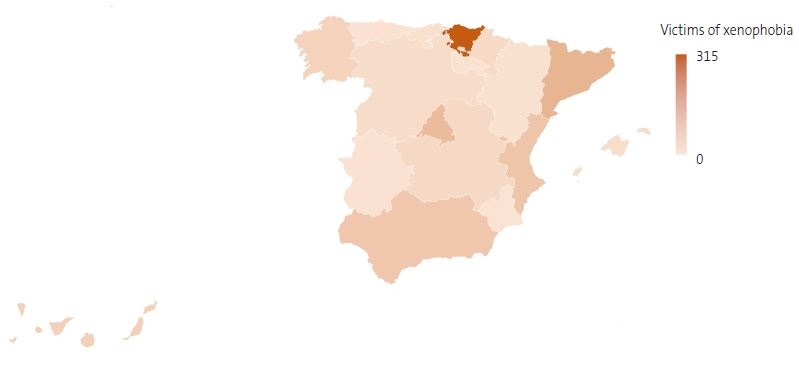 |

| Figure 6. Frequency distribution of victims of xenophobia by autonomous community and nationality in Spain in 2022 |
|---|
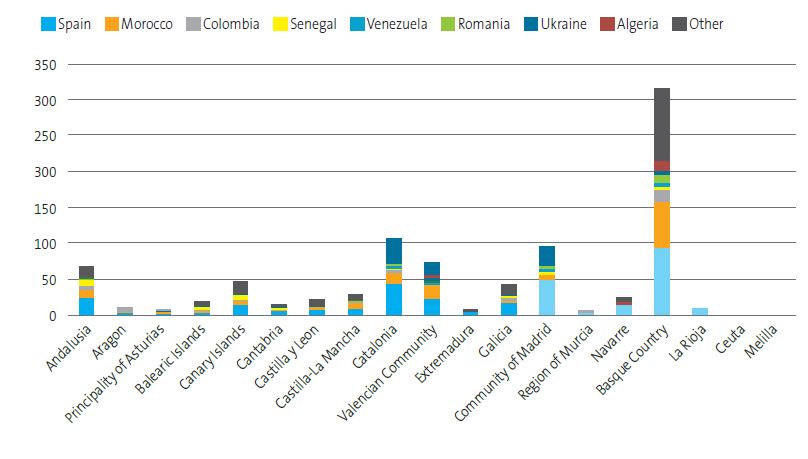 |

- Basque Country: 315 cases (Morocco, 64).
- Catalonia: 108 cases (Morocco, 17).
- Community of Madrid: 95 cases (Peru and Venezuela, 5).
- Valencian Community: 72 cases (Morocco, 17).
- Andalusia: 67 cases (Morocco, 11).
- Canary Islands: 47 cases (Senegal, 7).
- Galicia: 43 cases (Colombia and China, 4).
- Castilla-La Mancha: 28 cases (Morocco, 7).
- Navarre: 25 cases (Argelia, 3).
- Castilla and Leon: 21 cases (Morocco, 3).
- Balearic Islands: 19 cases (Morocco and Senegal, 4).
- Cantabria: 14 cases (Morocco, 2).
- Aragon: 10 cases (Colombia, 3).
- Asturias: 8 cases (Morocco and Venezuela, 1).
- Extremadura: 8 cases (Morocco, 2).
- La Rioja: 6 cases (all Spain).
- Region of Murcia: 4 cases (Morocco and Guatemala, 1).
- Melilla: 1 case (Spain).
- Ceuta: 0 cases.
Immigrants are at increased risk of being the target of hate crimes. The Basque Country stood out in this respect.13 According to data from the Ministry of the Interior,14 in 2022 there were 1 869 recorded cases of hate crime in Spain, of which 755 (43.5%) were motivated by racism and xenophobia. The Basque Country was the autonomous community with the highest frequency of xenophobic hate crimes (407 cases), significantly ahead of Catalonia (253) and the Community of Madrid (237). This difference can be attributed, in part, to an enhanced capacity of Basque institutions for the detection, recording and reporting of these crimes, which, in turn, results from the implementation of specific protocols, specific police training and increased awareness in the community. It would be interesting to carry out studies comparing different protocols by autonomous community and evaluating their outcomes.
Gender violence
In 2022, 67.3% of deaths resulting from gender violence occurred in Spanish nationals (33) and 32.7% in victims of other nationalities (16). Given that 88% of women in Spain are Spanish and only 12% are from other countries, there is a higher proportion of victims in the immigrant population.
When it came to the nationality of the perpetrator, in 2022, 61.2% of perpetrators (30) were Spanish.
In 2022, there were 957 Spanish children and 159 children with other nationalities aged 0 to 14 years who were in the custody of the state or subject to other child protection measures due to gender violence.
In Spain, in 2022, there were 5 787 545 Spanish minors and 776 507 minors with other nationalities. Thus, the risk of exposure to gender violence was slightly greater in immigrant children compared to Spanish children (OR: 1.24; 95% CI: 1.05-1.46).
Immigrant women and children under 15 years from immigrant families are at increased risk of gender violence and other adverse experiences compared to the general population.
Alcohol use
A survey that assessed alcohol use in the past 12 months in Spain found the following:
- 15% of Spaniards reported alcohol consumption, especially youth aged 16 to 24 years (OR: 1.83; 95% CI: 1.002-3.364).
- In the group of foreign nationals, 64.52% reported alcohol consumption, with a higher proportion in the group aged 25 to 64 years, although the difference was not significant.
- In relation to sex and nationality:
- Spanish men consume more alcohol between ages 25 and 64 years (83.69%) compared to men of other nationalities (73.69%).
- In the group of women aged 16 to 24 years, the prevalence of alcohol consumption is slightly greater in Spanish women (70.78%) compared to women of other nationalities (53.34%) (OR: 2.119; 95% CI: 1.183-3.797).
- The prevalence of alcohol consumption in foreign women was highest between 25 and 64 years (58.6%). When we compared it to the prevalence in Spanish women in the same age interval (62.98%), the difference was not statistically significant.
The prevalence of alcohol use was lower in the immigrant population, possibly due to differences in customs and religious beliefs. We did not find data allowing us to make comparisons based on religion, nationality or sex.
Access to health care
We evaluated difficulty accessing medical care, dental care, medication and mental health services due to economic reasons in the population residing in Spain in 2022.15 We found the following (Table 2):
| Table 2. Percentage of people who experience difficulties accessing health care | ||||||||
|---|---|---|---|---|---|---|---|---|
| Medical care | Dental care | Prescription dispensation | Mental health services | |||||
| Yes | No | Yes | No | Yes | No | Yes | No | |
| Both sexes | ||||||||
| Spanish nationals | ||||||||
| Total | 1.4% | 77.7% | 6.3% | 67.7% | 0.7% | 74.2% | 0.6% | 51.4% |
| 15-24 years | 0.1% | 9% | 0.4% | 8.3% | 0.04% | 8.3% | 0.04% | 6% |
| 25-64 years | 1% | 48.9% | 4.5% | 43% | 0.5% | 46.2% | 0.4% | 32.4% |
| ≥65 years | 0.3% | 19.8% | 1.4% | 16.4% | 0.1% | 19.7% | 0.1% | 13% |
| Foreign nationals | ||||||||
| Total | 2.9% | 96.2% | 18.7% | 75.2% | 2.2% | 91.9% | 0.8% | 66.9% |
| 15-24 years | 0.2% | 11.3% | 1.2% | 9.8% | 0.03% | 11% | 0% | 8.7% |
| 25-64 years | 2.4% | 77.2% | 16.7% | 58.8% | 2% | 73.4% | 0.6% | 52.7% |
| ≥65 years | 0.3% | 7.7% | 0.8% | 6.6% | 0.2% | 7.5% | 0.2% | 5.5% |

- Foreign nationals had greater difficulty accessing medical care (2.96%). OR: 1.73; 95% CI: 1.46-2.06.
- By age group, adults (25-64 years) and older adults (65+) experienced significant difficulties. Adults, OR: 1.58 (95% CI: 1.30-1.93); older adults, OR: 2.96 (95% CI: 1.79-4.88).
- The data indicated significant risk in relation to dental care associated with foreign nationality (OR: 2.68; 95% CI: 2.48-2.90). This was significant in every age group.
- Age 15-24 years (OR: 2.16; 95% CI: 1.61-2.89).
- Age 25-64 years (OR: 2.74; 95% CI: 2.51-2.99).
- Age 65+ (OR: 1.49; 95% CI: 1.08-2.04).
- Foreign nationals experienced greater difficulty when it came to dispensation of prescribed medication (OR 2.55; 95% CI: 2.07-3.15), especially those aged 25-64 years (OR 2.44; 95% CI: 1.94-3.07) or more than 64 years (OR 3.63; 95% CI: 1.90-6.90).
- When it came to mental health, there were only significant differences in the older population, with decreased access in the non-Spanish population (OR 4.15; 95% CI, 2.20-7.84).
Foreign nationals accounted for only 5.8% of the population aged more than 55 years. Immigrants had greater difficulty accessing health care due to their socioeconomic status, which has an impact on their health.
We did not find comparative data by autonomous community, country or origin or language.
Mental health
Mental health status was assessed in children aged 4 to 15 years.16 Variables were scored on a scale of 0 (best) to 10 (poorest), except prosocial status, which was reverse-scored from 0 (poorest) to 10 (best).
- Emotional symptoms: frequency of complaints of headache, stomachache, nausea; significant worry; generally sad or unhappy; nervous or clingy in new situations. Score: 1.94 in Spanish children vs 2.19 in foreign children.
- Conduct problems: frequent tantrums, disobedience, fights with other children, steals from home or school. Average: 1.95 in Spanish children vs 1.98 in foreign children.
- Hyperactivity: restless, overactive, unable to be still for long, constantly fidgeting or disruptive, easily distracted with wandering concentration. Spanish children had a score of 4.20 while foreign children had a score of 4.54.
- Peer problems: tends to be solitary and play alone, has at least one good friend, is generally liked by other children, picked on or bullied by other children, gets on better with adults than with other children: 1.19 in Spanish children vs 2.03 in foreign children.
- Prosocial behavior: considerate of other people’s feelings, shares treats, toys, pencils with others, helpful if someone is upset, hurt or ill, kind to younger children and often volunteers to help. Score: 8.71 in Spanish children vs 8.64 in foreign children.
The mental health status of immigrant children is not significantly poorer compared to Spanish children.
It is important to consider that we obtained some of the data from official registries and some from surveys, which can be a source of selection bias. Furthermore, the data for Ceuta and Melilla must be interpreted with caution due to the lack of registries.
CONCLUSIONES
The immigrant population in Spain is characterized by a lower educational attainment, lower income, poor housing conditions and decreased health care access. Policies must be implemented to promote education, reduce poverty and improve health care accessibility in order to reduce these inequities in the medium to long term.
CONFLICTS OF INTEREST
The authors have no conflicts of interest to declare in relation to the preparation and publication of this article.
AUTHORSHIP
Author contributions: drafting of manuscript (SMC), revision of manuscript (JIPC).
ABBREVIATIONS
LCS: Living Conditions Survey · OR: odds ratio · PAHO: Pan American Health Organization · SDH: social determinant of health · WHO: Organización Mundial de la Salud.
REFERENCES
- Preamble to the Constitution of the World Health Organization. In: WHO [online] [accessed 06/05/2025]. Available at https://www.who.int/about/governance/constitution
- Determinantes sociales de la salud. In: PAHO [online] [accessed 06/05/2025]. Available at www.paho.org/es/temas/determinantes-sociales-salud
- Eddy Ives LS, Ochando Perales G. Cambios sociales en la familia, la escuela y la sociedad. Su influencia en el desarrollo. Papel del pediatra. In: I Curso de psiquiatría del niño y adolescente para pediatras (SEMA). Directors: Hidalgo Vicario MI y Rodríguez Hernández P. 2017;15:1-12 [online] [accessed 06/05/2025]. Available at www.cursopsiquiatriasema.com/tema-15-cambios-sociales-en-la-familia-la-escuela-y-la-sociedad-su-influencia-en-el-desarrollo-papel-del-pediatra/
- Pérez Candas JI. Programa de identificación del riesgo psicosocial en la infancia y la adolescencia (I). Form Act Pediatr Aten Prim. 2022:15(3):111-8.
- Gualdi-Russo E, Toselli S, Masotti S, Marzouk D, Sundquist K, Sundquist J. Health, growth and psychosocial adaptation of immigrant children. Eur J Public Health. 2014;1:16-25. https://doi.org/10.1093/eurpub/cku107
- Instituto Nacional de Estadística [online] [accessed 06/05/2025]. Available at https://www.ine.es/
- Portal Estadístico de Criminalidad. Ministerio del Interior [online] [accessed 06/05/2025]. Available at https://estadisticasdecriminalidad.ses.mir.es/publico/portalestadistico/
- Instituto de las Mujeres. Ministerio de Igualdad [online] [accessed 06/05/2025]. Available at www.inmujeres.gob.es/MujerCifras/Violencia/VictimasMortalesVG.htm
- Incapacidad de hacer frente a gastos económicos imprevistos (16 y más años) por nacionalidad y periodo. In: INE [online] [accessed 06/05/2025]. Available at https://www.ine.es/jaxi/Tabla.htm?path=/t00/ICV/dim1/l0/&file=13208.px&L=0
- Tasa de riesgo de pobreza por nacionalidad. In: INE [online] [accessed 06/05/2025]. Available at www.ine.es/jaxiT3/Tabla.htm?t=9961&L=0
- Población con falta de espacio en la vivienda por nacionalidad y periodo. In: INE [online] [accessed 06/05/2025]. Available at www.ine.es/jaxi/Tabla.htm?path=/t00/ICV/dim1/l0/&file=12408.px&L=0
- Población que vive en hogares con determinadas deficiencias en la vivienda por nacionalidad y periodo. In: INE [online] [accessed 06/05/2025]. Available at www.ine.es/jaxi/Tabla.htm?path=/t00/ICV/dim1/l1/&file=12308.px&L=1
- Biltzen. Guía de actuación local ante incidentes de odio racista, xenófobo, antigitano y LGTBIfóbico. Vitoria-Gasteiz: Gobierno Vasco; 2022 [online] [accessed 06/05/2025]. Available at www.euskadi.eus/contenidos/proyecto/giza_eskubideak_plana01/es_def/adjuntos/Guia-de-actualizacion-local-WEB.pdf
- Informe sobre la evolución de los delitos de odio en España 2022. Informe evolución delitos de odio 2022. In: Ministerio del Interior [online] [accessed 06/05/2025]. Available at www.interior.gob.es/opencms/export/sites/default/.galleries/galeria-de-prensa/documentos-y-multimedia/balances-e-informes/2022/Informe_Evolucion_delitos_odio_2022.pdf
- Inaccesibilidad a distintos tipos de atención sanitaria por motivos económicos en los últimos 12 meses según sexo, país de nacimiento y grupo de edad. In: INE [online] [accessed 06/05/2025]. Available at www.ine.es/jaxi/Tabla.htm?tpx=47928
- Salud mental en población infantil según sexo, nacionalidad y grupo de edad. Media y desviación típica. Población de 4 a 15 years. In: INE [online] [accessed 06/05/2025]. Available at www.ine.es/jaxi/Tabla.htm?path=/t15/p419/a2006/p01/l0/&file=01040.px&L=0