
Vol. 21 - Num. 81
Original Papers
Impact of environmental pollution on paediatric hospital admissions: an ecological study
Marciano Sánchez Baylea, Raquel Martín Martínb, Enrique Villalobos Pintoc
aPediatra. Fundación para la Investigación, Estudio y Desarrollo de la Salud Pública. Madrid. España.
bPediatra. CS Párroco Julio Morate. Madrid. España.
cSección de Pediatría Hospitalaria. Hospital Infantil Universitario Niño Jesús. Madrid. España.
Correspondence: R Martín. E-mail: raquelmartin333@hotmail.com
Reference of this article: Sánchez Bayle M, Martín Martín R, Villalobos Pinto E. Impact of environmental pollution on paediatric hospital admissions: an ecological study. Rev Pediatr Aten Primaria. 2019;21:21-9.
Published in Internet: 15-01-2019 - Visits: 27254
Abstract
Objective: to assess the association between levels of airborne pollutants and paediatric hospital admissions, overall and due to respiratory problems.
Patients and methods: we conducted an ecological study in which the dependent variables were the number of total paediatric hospital admissions and the number of paediatric admissions due to respiratory problems, specifically pneumonia, asthma exacerbations and bronchiolitis, in a hospital located in the centre of Madrid over a period of 6 years (2012-2017). The independent variables were the mean levels of air pollutants recorded in the city of Madrid. We calculated correlation coefficients and fit multiple linear regression models. We compared the average number of admissions when the levels of nitrogen (NO2) were above and below 40 µg/m3.
Results: in the period under study, there were 10 512 admissions to the general paediatrics ward, of which 5328 (50.68%) were due to respiratory problems. We found a correlation between the levels of NO2, CO, and benzene and the number of overall admissions and respiratory admissions, in every instance with a p-value of less than 0.0001. The multiple linear regression analysis revealed that the number of overall admissions was associated with NO2 levels (positively) and temperature (negatively), while respiratory admissions were associated to NO2 and benzene levels (positively) and temperature (negatively). We estimated that if the levels of NO2 had stayed below 40 µg/m3 throughout the study period, 8.37% (95 CI: 7.77 to 8.98) of total admissions and 6.73% (95 CI: 6 to 7.52) of respiratory admissions could have been avoided.
Conclusions: we found an association between the number of admissions, overall and for respiratory causes, in the paediatric age group and the levels of air pollutants, especially NO2. Improving air quality could prevent a significant proportion of paediatric hospital admissions, and promoting this change should be a priority for paediatricians.
Keywords
● Environmental pollution ● Hospital admissions ● Respiratory diseasesINTRODUCTION
Health is a fundamental human right, and breathing clean air contributes to it significantly.1 Air quality is substantially affected by the presence in the atmosphere of a series of substances of a diverse nature that are harmful to our health and referred to as pollutants.2 Environmental pollution involves an excessive concentration in the atmosphere of nitrogen dioxide (NO2), carbon monoxide (CO), sulfur dioxide (SO2), hydrocarbons such as benzene and particular matter in suspension with diameters of less than 2.5 μ (PM2.5) and 10 μ (PM10), among others. In large cities, as is the case of Madrid,3,4 pollution often makes the news, and the press publishes images of the famous smog cloud that illustrates how dirty the air we breathe is. International institutions such as the World Health Organization (WHO),5 the European Environment Agency and organizations such as Ecologistas en Acción6 periodically issue reports based on objective data and inform and alert of the noxious effects of air pollution on the population in general and children in particular.
“Don’t pollute my future!”7 and “Inheriting a sustainable world?: Atlas on children’s health and the environment”8 are two of the latest reports of the WHO on the environmental hazards that affect the paediatric population, emphasising the vulnerability of this collective. Certain anatomical and physiological characteristics determined by the immaturity of their organ systems, combined with behaviours characteristic of childhood (younger children crawl, bring their hands and various objects to their mouths) and social aspects of their lifestyles (children spend a fair amount of time outdoors) are among the reasons why their organisms are less capable, compared to adults, of neutralising and clearing external pollutants.9
An increasing number of studies have been contributing to a growing body of evidence that can eventually translate to public health policy.10 Establishing a causal relationship between environmental factors and their deleterious effects on health is very complicated, and taking into account the high cost associated with managing the diseases resulting from the poor quality of the air we breathe,11 the aim of our study was to assess the impact of environmental pollution on the frequency of admission to the general paediatrics ward, overall and due to respiratory problems (such as pneumonia, bronchiolitis, asthma exacerbations…). We also estimated the number of admissions that could have been avoided if the levels of NO2 had not exceeded 40 μg/m3, which is the recommended limit for this pollutant established by the WHO.
PATIENTS AND METHODS
We conducted an ecological study through the analysis of data retrieved from the discharge summaries of the Department of General Paediatrics of the Hospital Infantil del Niño Jesús, located in the Madrid city centre. We selected as dependent variables the paediatric hospital admissions in general and the paediatric hospital admissions due to respiratory problems such as pneumonia, bronchiolitis and asthma attacks in patients aged 0 to 18 years in the period from January 1, 2012 to December 31, 2017 (72 months).
We obtained the data on environmental pollution from the website of the Ayuntamiento de Madrid (City Council of Madrid, Department of Environment and Traffic, General Directorate of Transport Sustainability and Planning, Department of Air Protection).12 The values used in our analysis of the different pollutants (NO2, SO, CO, benzene and airborne particulate matter less than 10 μ and 2.5 μ in diameter) and of the temperatures during the months under study were the monthly mean values of the 24 automated stations that collect the basic data for air quality monitoring in the city of Madrid. We believe this was the best approach to assess the exposure to airborne pollutants of children admitted to our hospital, as they come from everywhere in the city. We also calculated the number of hospital admissions that could have been avoided if the air levels of NO2 had not reached 40 μg/m3 in any of the months under study.
The statistical analysis was performed with the SPSS 15.0 software. We summarised the basic data as mean and standard deviation for quantitative variables and as absolute frequencies and percentages for qualitative variables. We also calculated the corresponding 95% confidence intervals (95 CI).
We compared quantitative variables by means of the Mann-Whitney U test after verifying that they did not fit a normal distribution (Kolmogorov-Smirnov test). The comparisons between qualitative variables were made by means of the χ2 test. We defined statistical significance as a p- Environmental Performance p-value of less than 0.05 in any of the tests.
We assessed the association between all of the quantitative variables under study by calculating the Spearman correlation coefficient.
Subsequently, we performed a multivariate linear regression analysis, starting with the full model with stepwise backward removal of the variables that were not statistically significant (P < .05). We calculated the number of admissions that could have been avoided if the levels of NO2 had not exceeded the 40 μg/m3 threshold.
RESULTS
In the period under study, there were a total of 10 512 admissions to the paediatrics ward overall, of which 5328 (50.68%) were due to respiratory problems. The age range of patients was 0 to 18 years, with a mean age of 2.84 years for admissions overall, and of 2.38 years for respiratory admissions.
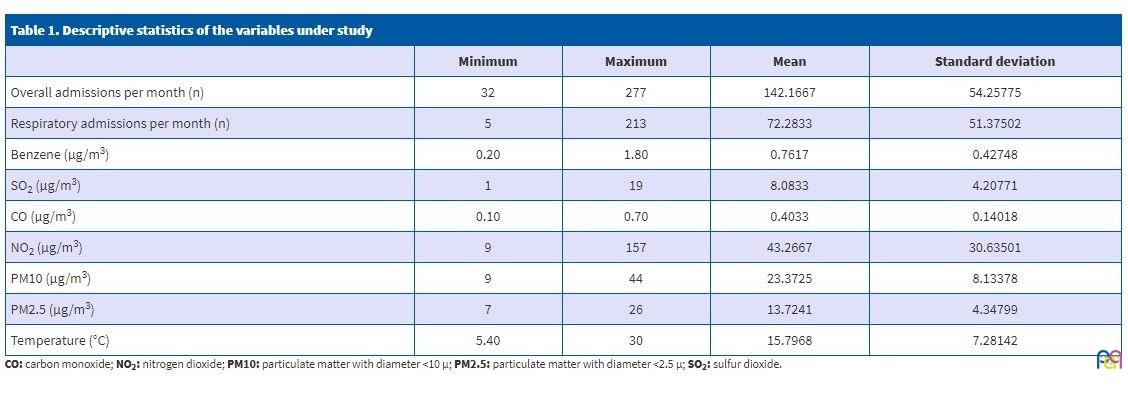
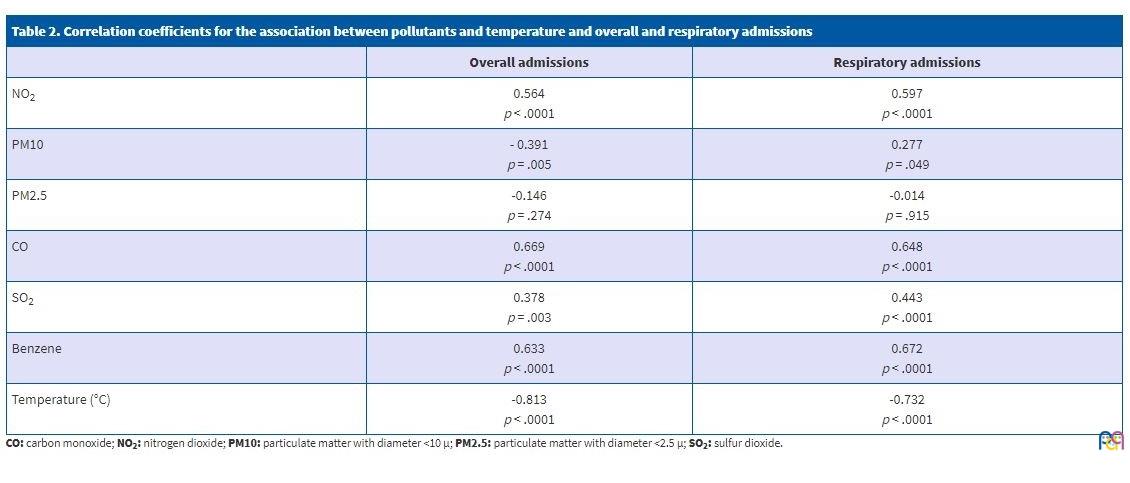
Table 1 shows the descriptive analysis of the variables under study. The mean number of admissions per month was 146 for overall admissions and 74 for respiratory admissions. We found substantial variability in the monthly number of overall and respiratory admissions and in the levels of air pollutants (as reflected by the difference between the maximum and minimum values for all these variables). Table 2 presents the Spearman correlation coefficients corresponding to the association between pollutant levels, ambient temperature and the number of overall hospital admissions and of admissions due to respiratory problems. We found statistically significant correlations with p-values smaller than 0.0001 with NO2, CO and benzene levels (positive) and temperature (negative), and also statistically significant correlations with SO2 (positive) and PM10 (negative); the only level that was not associated significantly with the number of overall or respiratory admissions corresponded to the concentration of PM2.5.
| Table 1. Descriptive statistics of the variables under study | ||||
|---|---|---|---|---|
| Minimum | Maximum | Mean | Standard deviation | |
| Overall admissions per month (n) | 32 | 277 | 142.1667 | 54.25775 |
| Respiratory admissions per month (n) | 5 | 213 | 72.2833 | 51.37502 |
| Benzene (μg/m3) | 0.20 | 1.80 | 0.7617 | 0.42748 |
| SO2 (μg/m3) | 1 | 19 | 8.0833 | 4.20771 |
| CO (μg/m3) | 0.10 | 0.70 | 0.4033 | 0.14018 |
| NO2 (μg/m3) | 9 | 157 | 43.2667 | 30.63501 |
| PM10 (μg/m3) | 9 | 44 | 23.3725 | 8.13378 |
| PM2.5 (μg/m3) | 7 | 26 | 13.7241 | 4.34799 |
| Temperature (°C) | 5.40 | 30 | 15.7968 | 7.28142 |
| Table 2. Correlation coefficients for the association between pollutants and temperature and overall and respiratory admissions | ||
|---|---|---|
| Overall admissions | Respiratory admissions | |
| NO2 | 0.564 p < .0001 |
0.597 p < .0001 |
| PM10 | - 0.391 p = .005 |
0.277 p = .049 |
| PM2.5 | -0.146 p = .274 |
-0.014 p = .915 |
| CO | 0.669 p < .0001 |
0.648 p < .0001 |
| SO2 | 0.378 p = .003 |
0.443 p < .0001 |
| Benzene | 0.633 p < .0001 |
0.672 p < .0001 |
| Temperature (°C) | -0.813 p < .0001 |
-0.732 p < .0001 |
We found that in months when the levels of NO2 were of 40 μ/m3 or higher, the proportion of hospital admissions was significantly greater compared to months when this limit was not reached.
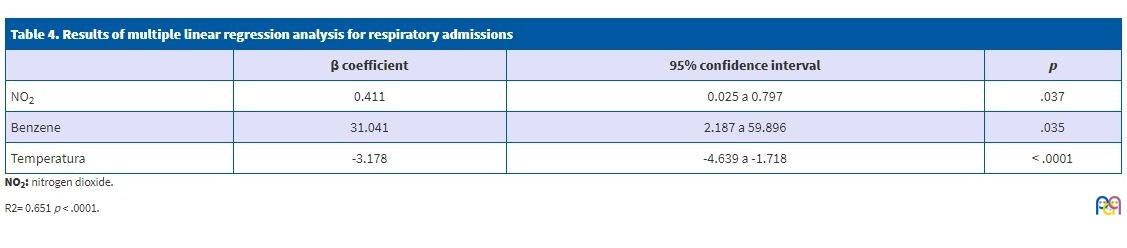
We fit multiple linear regression models for the association between the number of admissions (overall and respiratory, Tables 3 and 4) and the variables of interest, and found significant associations with the levels of NO2 (positive) and temperature (negative). When it came to respiratory admissions, the variables that remained in the model were the concentrations of NO2 and of benzene (positive association) and temperature (negative).
| Table 3. Results of multiple linear regression analysis for overall admissions | |||
|---|---|---|---|
| β coefficient | 95% confidence interval | p | |
| NO2 | 1.113 | 0.385 a 1.841 | .003 |
| Temperature | -5.151 | -6.354 a -3.949 | .0001 |

| Table 4. Results of multiple linear regression analysis for respiratory admissions | |||
|---|---|---|---|
| β coefficient | 95% confidence interval | p | |
| NO2 | 0.411 | 0.025 a 0.797 | .037 |
| Benzene | 31.041 | 2.187 a 59.896 | .035 |
| Temperatura | -3.178 | -4.639 a -1.718 | < .0001 |
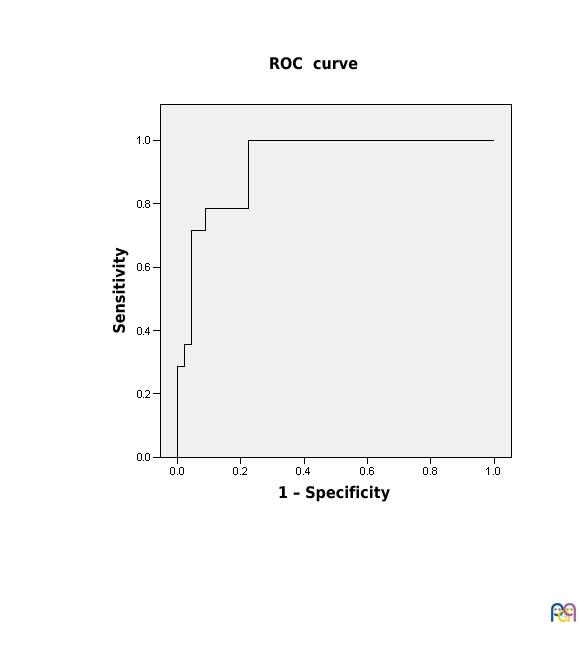
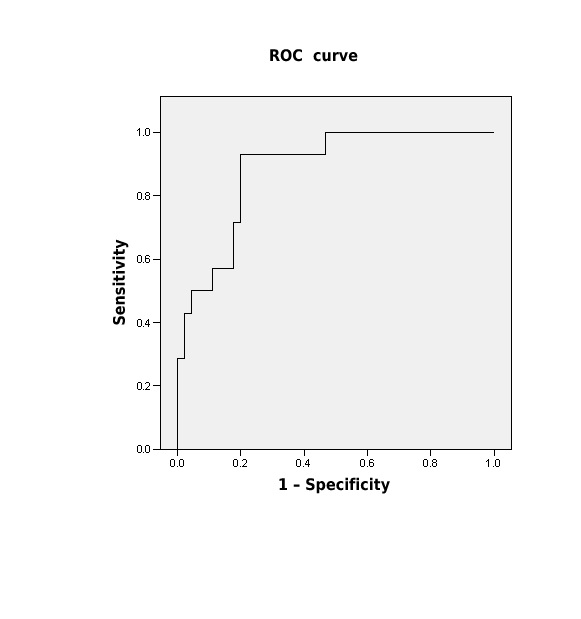
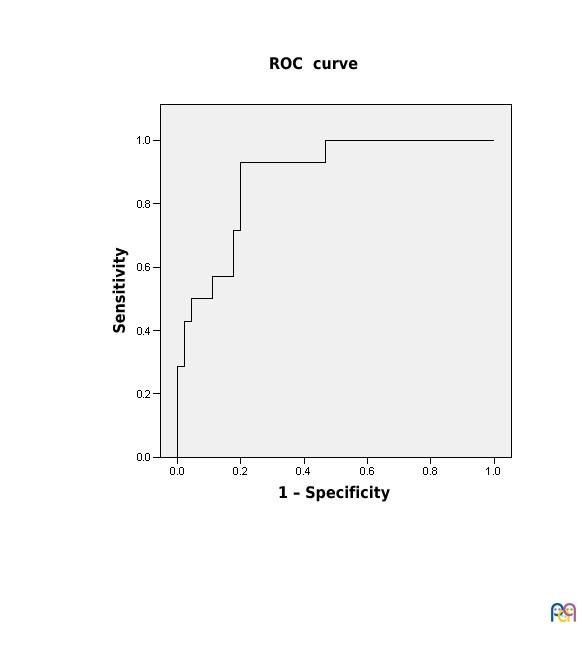
Figures 1 and 2 present the receiver operating characteristic (ROC) curves of the values obtained in the linear regression model for the total admissions (area under the curve [AUC] = 0.884; 95 CI: 0.795 to 0.973; P < .0001) and the number of respiratory admissions above the mean (AUC = 0.929; 95 CI: 0.864 to 0.994; P < .0001).
| Figure 1. ROC curve of the multiple linear regression values obtained for respiratory admissions above the mean |
|---|
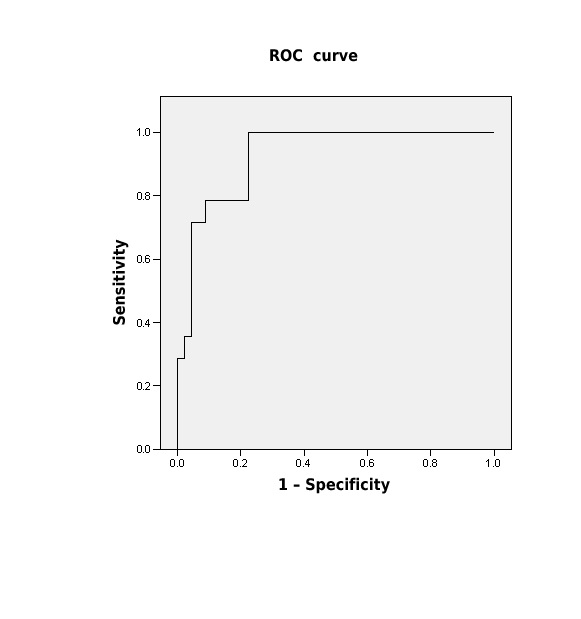 |
| Figure 2. ROC curve of the multiple linear regression values obtained for overall admissions above the mean |
|---|
 |
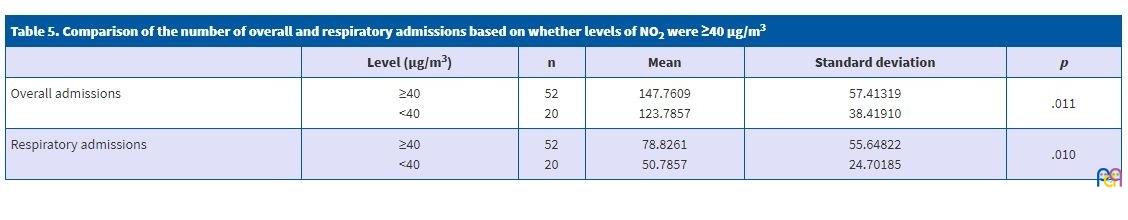
The total number of admissions that could have been avoided if the NO2 levels had stayed below 40 μg/m3 was 880, of which 360 (40.90%) would have corresponded to respiratory problems (Table 5). Last of all, we calculated the percentage of admissions that could have been prevented in the values of NO2 had stayed below 40 μg/m throughout the period under study, which amounted to 8.37% of all admissions overall (95 CI: 7.77 to 8.98) and 6.73% of all respiratory admissions (95 CI: 6-7 to 52).
| Table 5. Comparison of the number of overall and respiratory admissions based on whether levels of NO2 were ≥40 μg/m3 | |||||
|---|---|---|---|---|---|
| Level (μg/m3) | n | Mean | Standard deviation | p | |
| Overall admissions | ≥40 <40 |
52 20 |
147.7609 123.7857 |
57.41319 38.41910 |
.011 |
| Respiratory admissions | ≥40 <40 |
52 20 |
78.8261 50.7857 |
55.64822 24.70185 |
.010 |
DISCUSSION
In 2005, the WHO established recommended limits for each pollutant, warning that the presence of those substances above said limits involved a serious environmental risk,13 with the environment understood as the medium where life unfolds, which includes the air, water, soil, living beings and the relationship between them. According to the WHO, pollution is responsible for nearly 2 million paediatric deaths worldwide and more than 30 000 in Europe every year.14
Given the importance of this subject, it has been years since international organizations, governments and research groups started developing series of strategies and projects focused on specific environmental factors in relation to children, as they are the most vulnerable population.15,16 In Spain, one of the most interesting initiatives is the Infancia y Medio Ambiente (Childhood and environment, INMA)17 project, which started in 1998. It involves a research network with several open lines of investigation, led by Jordi Sunyer et al. It started with the study of the pregnant mothers of 4000 children, with a longitudinal followup of the diseases developed by the cohort through 18 years of age, analysing their association with the levels of air pollutants and thus the role of pollution in disease. The conclusions of every project and study conducted so far is that children’s physical, social and intellectual development requires a safe and protected environment, which makes pollution the most pervasive threat to child health.
The literature we reviewed on the subject usually refers to the relationship with respiratory diseases in children, 18-20 which are the most frequent type, especially asthma exacerbations and air pollution, with hospital admissions due to asthma increasing along pollution peaks 21,22; our results were consistent with this. Our study also found an increase in overall admissions, that is, admissions by other causes that increased with increasing levels of CO, benzene and NO2. Negrisoli et al.23 have found an increase in admissions due to pneumonia. Other studies have analysed the association between air pollution and other types of disorders, for instance, one by Kaplan et al.24 found an association between some cases of appendicitis and exposure to polluted air. Many studies have warned of the impact on attention in children, which may decrease on days when they are exposed to higher levels of pollution.25-27 Mortamais et al.28 have also found an association with attention-deficit hyperactivity disorder. A study conducted by Yang et al.29 found a correlation between air pollution and autism.
The report published by Ecologistas en Acción on the air quality in Spain in 201630 evinced that the measures taken by the government to address pollution were inadequate, which led the European Commission to refer the Spanish government to court for failure to respect the air quality standards established for NO2, a pollutant that mostly results from motor vehicle emissions.
Our findings confirmed that the monitoring stations in Madrid registered excessive levels of NO2, CO and benzene. These results were consistent with those of the study conducted by Martín Rivada et al.31 Most of the reviewed literature on the impact of pollution on children are hospital-based and thus represent the cases of patients with a greater severity of disease.
Recently, data have been published on patients managed at the primary care level32 for respiratory problems in relation to pollutant levels; the health problems managed on an outpatient basis are less severe and thus more common. The published evidence demonstrates a significant association that is independent of the care setting between the number of hospital admissions (overall and respiratory) and outpatient visits and the levels of airborne pollutants, especially NO2 in excess of 40 g/m3. In recent years, the monitoring stations of Madrid have recorded levels exceeding the limits recommended by the European Union (EU) which, on the other hand, are even more permissive compared to the limits recommended by the WHO and therefore more protective. Thus, Spanish cities usually exceed the recommended levels of NO2, and the study by Linares et al.33 showed how this is having a short-term impact on mortality rates in the population. In Spain, a recent study conducted by Díaz et al.34 between 2000 and 2009 found an association between the concentration of ozone in the atmosphere and increased mortality due to cardiorespiratory diseases.
The negative impact of temperature observed in our linear regression analysis may be related to the fact that low temperatures favour the propagation of certain viruses and thus the development of respiratory infections, which are the most frequent reason for hospital admission in the paediatric population.35
The report issued by the competent Ministry in Spain36 on the levels of NO2 in the country in 2016 shows an overall improvement compared to the previous year, but in large cities such as Madrid, the levels of different pollutants exceeded the limits recommended by the WHO.
We need to join our efforts, increasing the collaboration between governments, non-profit organizations and international organizations and taking into account the contribution of the studies performed by health professionals.
The Environmental Performance Index,37 which has been in use for 20 years, ranks Spain in the 12th position among 180 countries in 2018. This report is issued every 2 years by Yale University and assesses the ecosystem vitality policies and environmental performance of different countries.
Paediatric Environmental Health Specialty Units in Europe,38,39 which followed the creation of similar units in the United States in 1998, are clinical units where health professionals, including paediatricians, assess and identify the influence of environmental factors in the disease of patients, which corroborates the privileged position of paediatricians in the field of environmental health to protect children.
Our study has the limitations intrinsic to all ecological studies, chief of which is that the population constitutes the unit of study, that is, that we observed the association between an exposure and the outcomes in a population but were unable to establish the association between exposure in a single individual and his or her health condition. As a novel contribution, we present the data collected in the years under study on the admissions (due to all causes and to respiratory disease) that could have been prevented.
In conclusion, the results of our study corroborate that there is a correlation between paediatric hospital admissions and the levels of air pollution in the city, with pollution peaks coinciding with increases in overall and respiratory paediatric admissions and admissions decreasing with decreasing levels of NO2. In addition, our study demonstrates that controlling pollution could often prevent hospital admissions. Pollution is harmful even at low levels and in the short term, and there is no actual threshold under which it has no adverse effects on human health.40 Considering that motor vehicle emissions are the main source of NO2, controlling and reducing traffic in large cities has been proposed to reduce pollution, while implementing additional measures to promote other means of transport through the city. The relationship between health and environment should be considered an essential aspect in global development and economic policy-making.
CONFLICTS OF INTEREST
The authors have no conflicts of interest to declare in relation to the preparation and publication of this article.
ABBREVIATIONS
CI: confidence interval · CO: carbon monoxide · · NO2: nitrogen dioxide · PM10: particulate matter with diameters <10 μ · PM2.5: particulate matter with diameters o <2.5 μ · SO2: sulfur dioxide ·ROC: receiver operating characteristic ·WHO: World Health Organization.
REFERENCES
- Gascón M, Sunyer J. Contaminación del aire y salud respiratoria en niños. Arch Bronconeumol. 2015;5:371-2.
- Oyarzún M. Contaminación aérea y sus efectos en la salud. Rev Chil Enf Resp. 2010;26:16-25.
- Caballero F. La contaminación aumenta en 2017 en Madrid e incumple por octavo año consecutivo la normativa europea. En: Eldiario.es [en línea] [consultado el 11/01/2019]. Disponible en www.eldiario.es/contaminación-Madrid-incumple-consecutivo-normativa_0_730027237.html
- Cerrillo A. La población urbana expuesta a aire sucio es, según la OMS, 8 veces superior a lo que dicen los datos de la UE. En: La Vanguardia [en línea] [consultado el 11/01/2019]. Disponible en www.lavanguardia.com/natural/20161124/412124325578/polucion-habitantes-ciudades-oms-ue.html
- Calidad del aire ambiente (exterior) y salud. En: Organización Mundial de la Salud [en línea] [consultado el 11/01/2019]. Disponible en www.who.int/es/news-room/fact-sheets/detail/ambient-(outdoor)-air-quality-and-health
- La calidad del aire en la ciudad de Madrid, 2017. En: Ecologistas en Acción [en línea] [consultado el 11/01/2019]. Disponible en www.ecologistasenaccion.org/IMG/pdf/info-calidad-aire-madrid-2017.pdf
- ¡No contamines mi futuro! El impacto de los factores medioambientales en la salud infantil. En: Organización Mundial de la Salud [en línea] [consultado el 11/01/2019]. Disponible en http://apps.who.int/iris/handle/10665/260430
- ¿La herencia de un mundo sostenible? Atlas sobre salud infantil y medio ambiente. Ginebra: Organización Mundial de la Salud; 2018.
- Linares C, Díaz J. Efectos de las partículas de diámetro inferior a 2,5 micras PM (2,5) sobre los ingresos hospitalarios en niños menores de 10 años en Madrid. Gac Sanit. 2009;23:192-7.
- Sunyer J, Ribas-Fito N. Efectos ambientales en la salud infantil. En: El País [en línea] [consultado el 11/01/2019]. Disponible en https://elpais.com/diario/2003/04/08/salud/1049752802-850215.html
- Informe del Lancet Countdown sobre salud y cambio climático, 2017. El inicio de una transformación a nivel mundial para la salud pública después de 25 años de pasividad. En: The Lancet [en línea] [consultado el 11/01/2019]. Disponible en www.thelancet.com/pb/assets/raw/Lancet/Hubs/climate-change/Lancet_Countdown_2017_Executive_Summary_Spanish.pdf
- Sistema Integral de la Calidad del Aire, 2016. En: Ayuntamiento de Madrid [en línea] [consultado el 11/01/2019]. Disponible en www.mambiente.munimadrid.es/sica/scripts/index.php.
- Air quality guidelines for particulate matter, ozone, nitrógeno dioxide and sulfur dioxide. Global update 2005. En: Organización Mundial de la Salud [en línea] [consultado el 11/01/2019]. Disponible en http://apps.who.int/iris/bitstream/handle/10665/69477/WHO_SDE_PHE_OEH_06.02_eng.pdf;jsessionid=46BF13BC6C7FF027BFBB8424A8F7D2BE?sequence=1.
- Las consecuencias de la contaminación ambiental: 1,7 millones de defunciones infantiles anuales, según la OMS, 6 de marzo de 2017. En: Organización Mundial de la Salud [en línea] [consultado el 11/01/2019]. Disponible en www.who.int/es/news-room/detail/06-03-2017-the-cost-of-a-polluted-environment-1-7-million-child-deaths-a-year-says-who
- The Lancet. Turning climate change legislation into public health policy. Lancet. 2018;391:1865.
- Sandín Vázquez M, Sarriá Santamera A. Evaluación de impacto en salud y medio ambiente. Agencia de Evaluación de Tecnologías Sanitarias (AETS). Madrid: Instituto de Salud Carlos III; 2007.
- Ramón R, Ballester F, Rebagliato M, Ribas N, Torrent M, Fernández M, et al. La red de investigación “Infancia y medioambiente” (Red INMA): protocolo de estudio. Rev Esp Salud Pública. 2005;79:203-20.
- Gavidia T, Pronczuk J, Sly PD. Impactos ambientales sobre la salud respiratoria de los niños. Carga global de las enfermedades respiratorias pediátricas ligada al ambiente. Rev Chil Enf Resp. 2009;25:99-108.
- Vargas S, Onatra W, Osorno L, Páez E, Sáenz O. Contaminación atmosférica y efectos respiratorios en niños, en mujeres embarazadas y en adultos mayores. Revista UDCA. Actualidad y Divulgación Científica. 2008;11:31-45.
- Salazar-Ceballos A, Álvarez-Miño L. Los efectos del material particulado 10 (PM 10) y de las variables climatológicas en las admisiones hospitalarias por enfermedades respiratorias en niños de la ciudad de Santa Marta, Colombia, 2008-2009. Revista Facultad de Ciencias de la Salud. 2011;8:127-42.
- Haneen J, Nieuwenhuijsen MJ. Traffic-related air pollution and chilhood asthma: recent advances and remaining gaps in the exposure assessment methods. Int Environ Res Public Health. 2017;14:312.
- Elizalde-Beiras I, Guillén-Grima F, Aguinaga-Ontoso I. Factores asociados al asma en los niños y adolescentes en la zona rural de Navarra (España). Aten Primaria. 2018;50:332-9.
- Negrisoli J, Fernando L, Nascimento C. Atmospheric pollutants and hospital admissions due to pneumonia in children. Rev Paul Pediatr. 2013;31:501-6.
- Kaplan GG, Dixon E, Panaccione R, Fong A, Chen L, Szyszkowicz M, et al. Effect of ambient air pollution on the incidence of apendicitis. CMAJ. 2009;181:591-7.
- Costa LG, Cole TB, Coburn J, Chang Y, Dao K, Roqué PJ. Neurotoxicity of traffic-related air pollution. Neurotoxicology. 2017;59:133-9.
- Sunyer J, Esnaola M, Álvarez-Pedrerol M, Forns J, Rivas I, López-Vicente M, et al. Association between traffic-related air pollution in schools and cognitive development in primary school children: a prospective cohort study. PLoS Med. 2015;12:e1001792.
- Suades-González E, Gascón M, Guxens M, Sunyer J. Air pollution and neuropsychological development: a review of the latest evidence. Endocrinology. 2015;156:3473-82.
- Mortamais M, Pujol J, van Drooge BL, Macia D, Martínez- Vilavella G, Reynes C, et al. Effect of exposure to polycyclic aromatic hydrocarbons on basal ganglia and attention-deficit hyperactivity disorder symptoms in primary school children. Environ Int. 2017;105:12-9.
- Yang C, Zhao W, Deng K, Zhou V, Zhou X, Hou Y. The association between air pollutants and autism spectrum disorders. Environ Sci Pollut Resp Int. 2017;24:15949-58.
- La calidad del aire en el Estado español durante 2017. En: Ecologistas en Acción [en línea] [consultado el 11/01/2019]. Disponible en www.ecologistasenaccion.org/wp-content/uploads/2018/06/informe-calidad-aire-2017.pdf
- Martín Rivada A, Sánchez Bayle M, Villalobos Pinto E, Calleja Gero ML. Contaminación ambiental e ingresos pediátricos en un área urbana. Acta Pediatr Esp. 2018;76:44-9.
- Martín Martín R, Sánchez Bayle M. Impacto de la contaminación ambiental en las consultas pediátricas de Atención Primaria: estudio ecológico. An Pediatr (Barc). 2017;89:80-5.
- Linares C, Falcón I, Ortiz C, Díaz J. An approach estimating the short-term effect of NO2 on daily mortality in Spanish cities. Environ Int. 2018;116:18-28.
- Díaz J, Ortiz C, Falcón I, Salvador C, Linares C. Short-term effect of tropospheric ozone on daily mortality in Spain. Atmospheric Environ. 2018;187:107-16.
- García García ML, Korta Murua J, Callejón A. Bronquiolitis aguda viral. Protoc Diagn Ter Pediatr. 2017;1:85-102.
- Evaluación de la calidad del aire en España 2016. En: Ministerio de Agricultura y Pesca, Alimentación y Medio Ambiente [en línea] [consultado el 11/01/2019]. Disponible en www.mapama.gob.es
- Hsu A, Zomer A. Environmental Performance Index. En: Wiley Stats Ref. Statistics Reference Online [en línea] [consultado el 11/01/2019]. Disponible en https://onlinelibrary.wiley.com/action/showCitFormats?doi=10.1002%2F9781118445112.stat03789.pub2
- Ortega García JA, Ferris i Tortajada J, Claudio Morales L, Berbel Tornero O. Unidades de salud medioambiental pediátrica en Europa: de la teoría a la acción. An Pediatr (Barc). 2005;63:143-51.
- Campillo I, López F, Ortega-García JA. Pediatría ambiental: la salud de los niños y el medio ambiente. Pediatr Integral. 2018;22:155e1-155e6.
- Di Q, Dai L, Wang Y. Association of short-term exposure to air pollution with mortality in older adults. JAMA. 2017;318:2446-56.