
Vol. 20 - Num. 78
Original Papers
Assessment of the development of a group of children born preterm compared to children born to term
M.ª Laura Casado Sáncheza, Ángeles Gutiérrez Garcíab, Jesús Ruiz Contrerasc
aPediatra. CS San Blas. Parla. Madrid. España.
bDepartamento de Didáctica y Teoría de la Educación. Facultad de Formación de Profesorado y Educación. Universidad Autónoma de Madrid. Madrid.
cServicio de Pediatría. Hospital Universitario 12 de Octubre. Universidad Complutense de Madrid. Madrid. España.
Correspondence: ML Casado. E-mail: cs.mlaura@yahoo.es
Reference of this article: Casado Sánchez ML, Gutiérrez García A, Ruiz Contreras J. Assessment of the development of a group of children born preterm compared to children born to term. Rev Pediatr Aten Primaria. 2018;20:121-31.
Published in Internet: 04-04-2018 - Visits: 24727
Abstract
Introduction: at present, preterm births amount to 10% of total births in Spain and account for 50% of disabilities in children, and it is believed that children born preterm birth are at higher risk of experiencing developmental problems compared to children born at term. Our study aimed to determine whether preterm infants are more likely to have developmental delays.
Patients and methods: the study included 58 children aged less than 6 years managed at a primary care centre in the region of Madrid born between 34 and 37 weeks’ gestation (late preterm) and matched controls born to term. We used the Battelle Developmental Inventory to assess the presence of developmental delays.
Results: we did not find differences between the two groups in the mean scores for the total test or the different development domains, nor in the number of children with relevant standard deviations from the mean (-1.0, -1.5 and -2) versus those without such deviation. Some degree of delay compared to normal development was found in 24 of the children (20.69%), and the delay had not been suspected before testing in 14 of them (58.3%). We found a prevalence of developmental delay of 0.224 in children born at term and 0.207 in children born late preterm.
Conclusions: we did not significant differences in the prevalence of developmental delays between the two groups. Delays had not been suspected before testing in more than 50% of the children in whom they were identified, which evinces the need to include psychomotor delay screening protocols in the primary care child wellness checkup programme for the early diagnosis of these problems.
Keywords
● Development indicators ● Developmental disabilities ● Full-term birth ● Premature infantINTRODUCTION
The growing population of preterm newborns in neonatal units has led to the emergence of new health problems,1 such as developmental delays. This has motivated a search for pre-emptive therapies to minimise the sequelae of preterm birth.2
Studies have been conducted that prove that morbidity increases with decreasing gestational age at birth.2 Nevertheless, children born late preterm, a growing population, may also be at higher risk of neurodevelopmental and even psychiatric or behavioural disorders in adulthood3,4 compared to children born to term.
At present, preterm births amount to 8% to 10% of births in Spain and account for 75% of perinatal deaths and 50% of disabilities in children.5
Developmental delay or psychomotor retardation refer to a slowing down or delay in the attainment of developmental milestones without underlying disease, while developmental disorder refers to a disturbance, pervasive change or abnormal pattern in development.6
Several studies have demonstrated that the aetiology of developmental delays is widely heterogeneous, with causes including maternal risk factors (mental health problem, infection, substance use, teen mother or maternal age > 35-40 years), child risk factors (malnutrition after birth, exposure to noxious substances such as lead, infection, genetic disorders, mechanical ventilation, exchange transfusion…), lack of care or neglect of the child or history of disease in the family, among others,7,8 and that early diagnosis and intervention to prevent these delays or attenuate their impact results in the best outcomes in the short, medium and long term.9
It is hypothesised that many children born preterm between 34 and 37 weeks’ gestation experience abnormalities in development that can be identified at the primary care level. Our study attempted to determine whether these children were more likely to have developmental delays compared to children born to term.
PATIENTS AND METHODS
We conducted an observational and analytical cross-sectional study in the San Blas Primary Care Centre of Parla (Madrid, Spain).
Population under study
We included children aged 0 to 6 years managed in the paediatrics clinic of the San Blas Primary Care Centre that had been born between 34 and 37 weeks’ gestation (late preterm). Their controls were born at term (at 37 or more weeks’ gestation), matched for sex, and matched as closely as possible for birth date (birth date closest to the birth date of the case, before or after; all other conditions being equal, we arbitrarily chose to match with the birth dates posterior to that of the cases). All children were born between June 1, 2009 and May 31, 2015.
We calculated the sample size by using a formula for difference in means. The calculation was made for a two-tailed test, with a 1-α level of confidence of 95% and a power of 80%. We assumed that there was a clinically relevant difference in development when there was a difference of 3.5 months in the time needed to achieve developmental milestones compared to the normal pattern. We considered the overall standard deviation for controls in other Spanish studies, which resulted in an estimated variance of 184.10 The minimum sample size thus calculated was 58 children born preterm, to be matched with an equal number of controls born to term. We corroborated this result by calculating the sample size using the Epidat® 4.1 statistical software of the Department of Health of Galicia.11
We ordered the children born preterm that met the criteria by date of birth, youngest first. They were assigned consecutive numbers and randomised by means of a digital random number generator (http://nosetup.org/php_on_line/numero_aleatorio_2). Based on the previously calculated sample size, we selected a total 58 cases for our study (out of the total of 129 children), having previously compared the variables in the total preterm population and homogenised the data for the descriptive variables listed in Table 1, which we collected in an online form specifically developed for the study.12 We assessed the presence of developmental delays by means of the Battelle Developmental Inventory,13 which is considered the gold standard for the detection of developmental problems in early childhood through age 8 years.14,15
| Table 1. Descriptive variables under study | ||
|---|---|---|
| Age at time of screening Season of birth Sex Race Weeks of gestation School enrolment Age of school enrolment Number of siblings Birth order Singleton or twin delivery Maternal disease before pregnancy Maternal disease during pregnancy Maternal disease after pregnancy Paternal disease |
Perinatal health problems Admission to neonatal unit Neonatal health problems Subsequent health problems in child Maternal age at birth Paternal age at birth Birth weight Birth head circumference Apgar 1 minute Apgar 5 minutes Neurologic followup Other in-hospital followup Age followup visits ended Family history of developmental disorders |
Family member with developmental problems Paternal educational attainment Maternal educational attainment Educational attainment of main carer Main carer Maternal employment Paternal employment Household income level Number of household members Relationship of household members Abnormal results in developmental items of wellness checkup protocol Checkup in which abnormal results were found |

The Battelle Developmental Inventory includes a screening test whose results are highly correlated to the results of the whole diagnostic battery (0.96, except for the cognitive domain, for which it is 0.92).13 This is the screening test that was performed in every child, regardless of age, producing homogeneous data that allowed comparison.16 This screening test, comprised of 96 items, assesses the basic skills and milestones of children aged 0 to 8 years in the personal-social, adaptive, motor, language and cognitive domains.
We have expressed results in terms of raw scores and by the standard deviation (SD) from the mean (-1.0 -1.5, -2.0 SDs versus no relevant deviation), which would indicate potential delays.13,17
To reduce bias, we added the educational attainment and socioeconomic status of parents to the questionnaire.
Statistical analysis
We compared qualitative variables by means of the Pearson χ2 test or the Fisher exact test. When it came to normally distributed quantitative variables, we compared the means using the independent samples t test with a 95% confidence interval, or, when comparing more than 2 groups, one-way ANOVA with the Bonferroni, Tukey and Scheffe corrections. The nonparametric tests used for comparisons of non-normally distributed variables were the Mann-Whitney U and Kruskal-Wallis tests.
We defined statistical significance as a p-value greater than 0.05 (two-tailed test).
We analysed the data of children born preterm based on their chronological and corrected age through age 2 years. We have expressed prevalence as values between 0 and 1.
The data obtained through the online form were collected in an Excel ® table and analysed with the software IBM SPSS® Statistics version 22.
The study was approved by the Clinical Research Ethics Committee of the Hospital Universitario de Getafe and the Comisión Local de Apoyo a la Investigación (Local Board for Research Support) of southern Madrid. We provided parents with an informational flyer and obtained their informed consent.
RESULTS
A total of 2389 children born between June 1, 2009 and May 31, 2015 were included in the caseload assigned to the San Blas Primary Care Centre as of June 30 2015.
Children born preterm
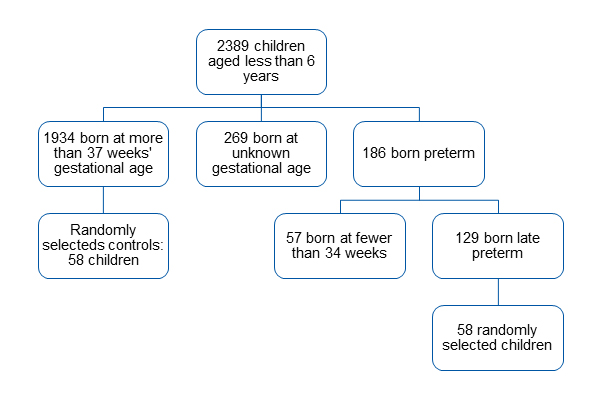
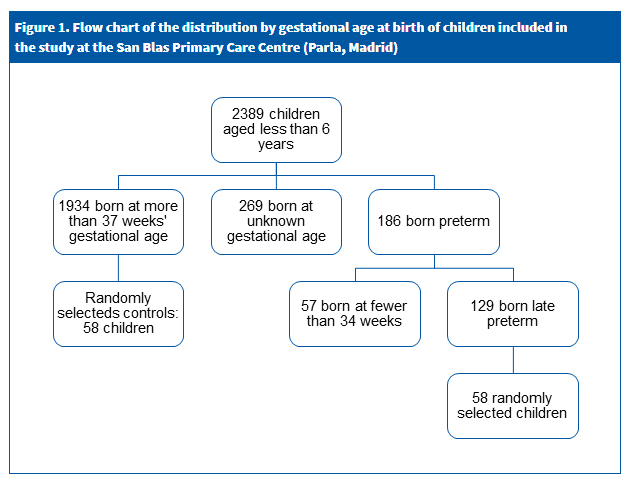
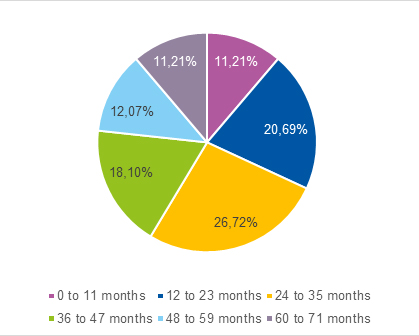
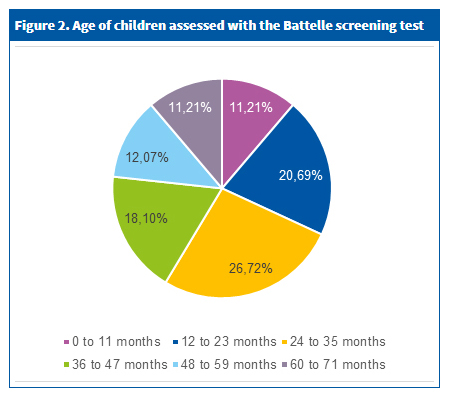
We identified 129 children born late preterm, of whom we selected 58 at random, amounting to 31.2% of children born preterm and 44.96% of children born late preterm managed in our centre. The flow chart in Fig. 1 shows the distribution of children by gestational age, while Fig. 2 shows the percentage distribution of children assessed with the Battelle screening test.
| Figure 1. Flow chart of the distribution by gestational age at birth of children included in the study at the San Blas Primary Care Centre (Parla, Madrid) |
|---|
 |
| Figure 2. Age of children assessed with the Battelle screening test |
|---|
 |
The sample of 58 children born late preterm and the total population of children born late preterm managed in our clinic were similar as regards the descriptive variables presented in Table 1. During the routine wellness checkup visits, only 1 of the 58 children had abnormal results in the developmental items, corresponding to 1.72% of the sample. Another child exhibited developmental problems but had normal results in the developmental items, data based on which we estimated a prevalence of developmental delays of 0.034 in children born preterm. When it came to the family history of delays, only 1 patient had a history in a close relative (sister).
| Table 2. Comparison of social and family characteristics in the groups of children born late preterm and born to term assessed with the Battelle test | |||
|---|---|---|---|
| Variable | Children born late preterm assessed with Battelle test 58 (95 CI) |
Children born to term assessed with Battelle test 58 (95 CI) |
Statistical significance |
| >Maternal age | 31.66 ± 5.61 (30.216 to 33.104) |
31.88 ± 4.91 (30.616 to 33.144) |
P .823 |
| >Paternal age | 33.83 ± 6.55 (32.144 to 35.516) |
34.39 ± 4.85 (33.142 to 35.638) |
P .602 |
| >Reported income (in euro) | 24816 ± 16953 (20542.966 to 29179.034) |
29307.27 ± 17447 (24817.099 to 33797.441) |
P .162 |
| Number of siblings | 1.16 ± 1.099 (0.877 to 1.443) |
0.83 ± 0.752 (0.636 to 1.024) |
P .062 |
| Birth order | 1.91 ± 0.978 (1.658 to 2.162) |
1.63 ± 0.645 (1.464 to 1.796) |
P .071 |
| Number of additional household members | 3.362 ± 1.2523 (3.040 to 3.684) |
3.069 ± 1.2685 (2.743 to 3.395) |
P .213 |
| Family history | 17.24% | 17.2% | P 1 |
| Maternal disease before pregnancy | 13.8% | 17.3% | P .798 |
| Maternal disease during pregnancy | 48.3% | 27.6% | P .035 |
| Maternal disease after pregnancy | 20.7% | 15.5% | P .630 |
| Paternal disease | 6.9% | 12.1% | P .528 |
| Mother employed/unemployed | 57%/43% | 55%/45% | P 1 |
| Father employed/unemployed | 81%/17% | 91%/9% | P .177 |
| Mother is main caregiver (exclusively) | 94.8% (69%) | 93.1% (65.5%) | P 1 (P .843) |
| Maternal educational attainment | No education 3.4% Primary education 25.9% Secondary education 48.3% University degree 20.7% UK/NA 1.7% |
No education 1.7% Primary education 37.9% Secondary education 36.2% University degree 22.4% Master’s degree 1.7% |
P .454 |
| Children with mothers with a primary education (%) | 25.9% | 37.9% | P .232 |
| Paternal educational attainment | No education 1.7% Primary education 29.3% Secondary education 48.3% University degree 15.5% UK/NA 5.2% |
No education 1.7% Primary education 36.2% Secondary education 44.8% University degree 13.8% UK/NA 3.4% |
P .945 |
The parents of every child in the sample were healthy, excepting the potential presence of gestational endocrine disorders.
Children born at term
The distribution by gestational age of children born at term followed a normal distribution, with a higher percentage of children born at 39 weeks.
One child had an isolated language delay, and delay was suspected in another 2. Thus, the prevalence of delays was 0.052. Only 1 child had a first-degree relative with a diagnosed delay (father).
The parents in this group were also healthy, with the exception of endocrine disorders (mainly gestational diabetes).
Group comparison
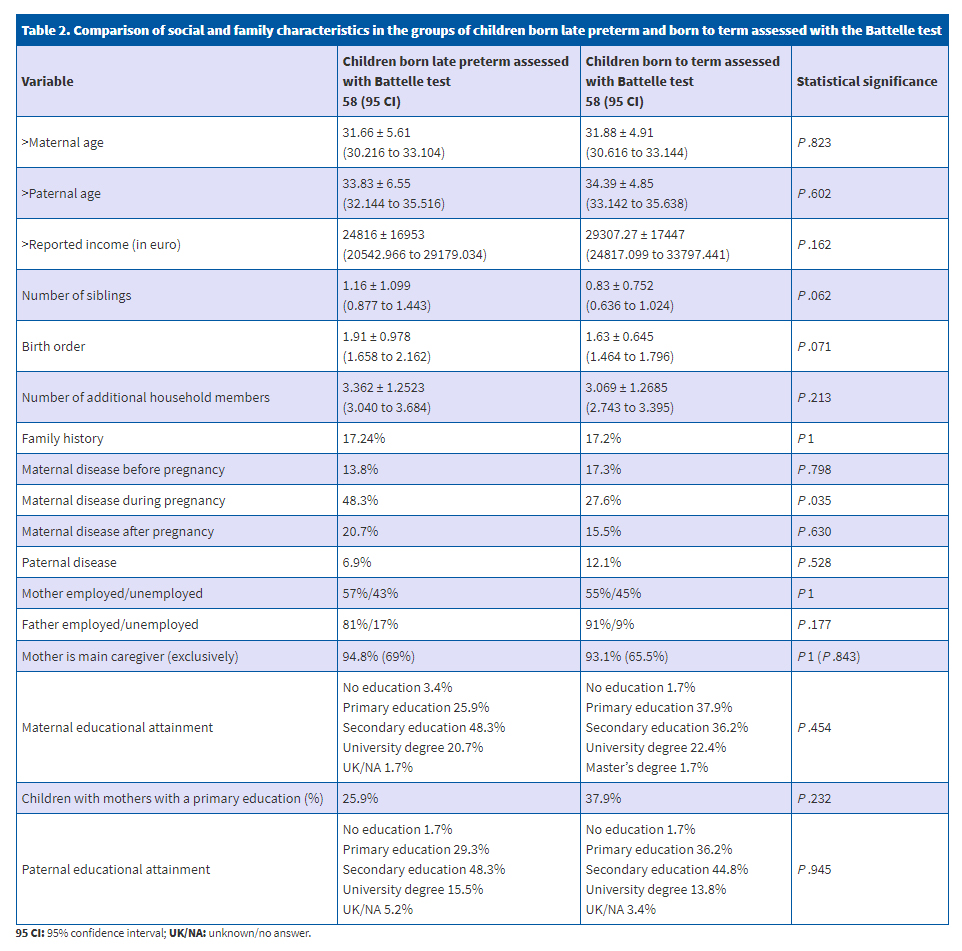
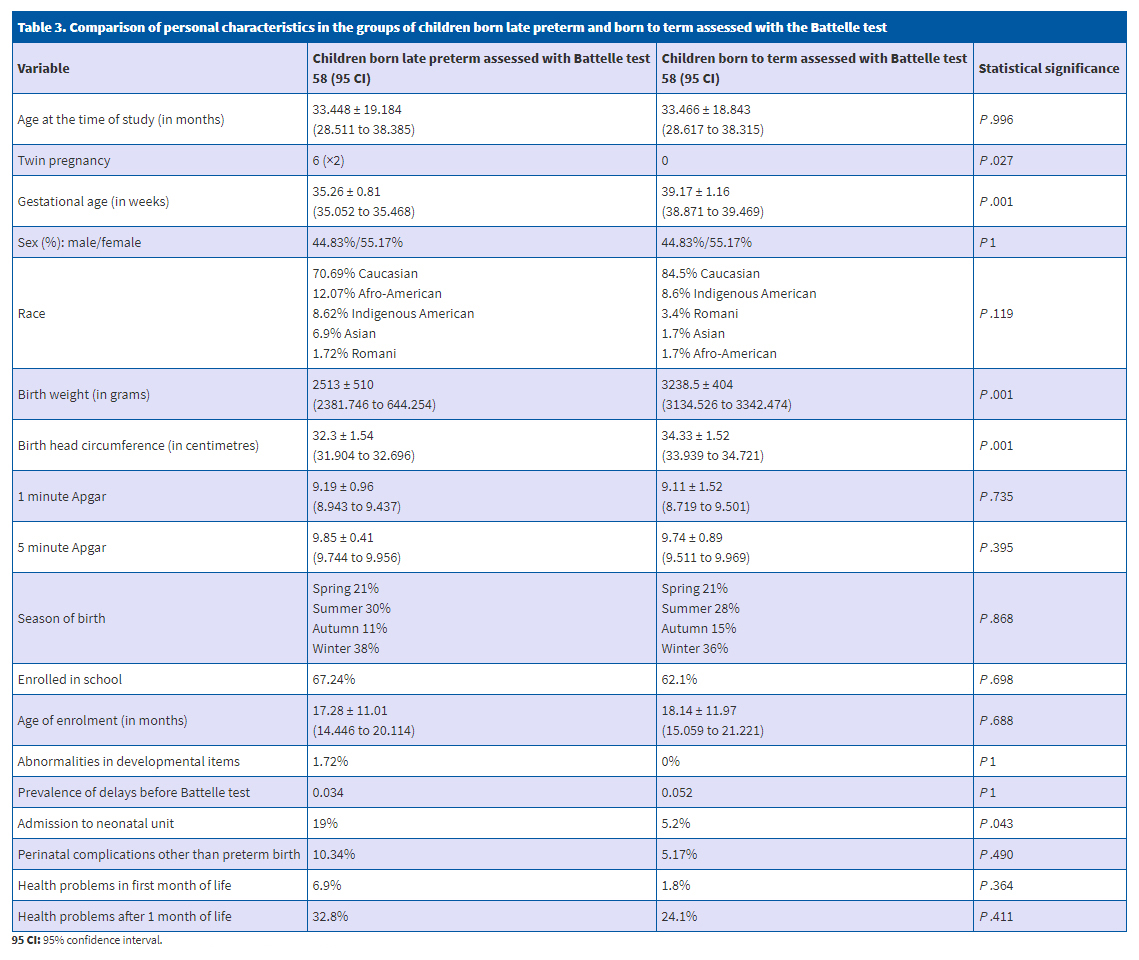
Table 2 compares socioeconomic variables in the families of the two groups under study, while Table 3 compares variables between children born preterm and children born at term that were assessed with the Battelle screening test. The demographic characteristics were similar in both groups. We only found significant differences in maternal disease during gestation and variables related to preterm birth: gestational age, twin pregnancy, admission to neonatal unit and birth weight and head circumference.
| Table 3. Comparison of personal characteristics in the groups of children born late preterm and born to term assessed with the Battelle test | |||
|---|---|---|---|
| Variable | Children born late preterm assessed with Battelle test 58 (95 CI) |
Children born to term assessed with Battelle test 58 (95 CI) |
Statistical significance |
| Age at the time of study (in months) | 33.448 ± 19.184 (28.511 to 38.385) |
33.466 ± 18.843 (28.617 to 38.315) |
P .996 |
| Twin pregnancy | 6 (×2) | 0 | P .027 |
| Gestational age (in weeks) | 35.26 ± 0.81 (35.052 to 35.468) |
39.17 ± 1.16 (38.871 to 39.469) |
P .001 |
| Sex (%): male/female | 44.83%/55.17% | 44.83%/55.17% | P 1 |
| Race | 70.69% Caucasian 12.07% Afro-American 8.62% Indigenous American 6.9% Asian 1.72% Romani |
84.5% Caucasian 8.6% Indigenous American 3.4% Romani 1.7% Asian 1.7% Afro-American |
P .119 |
| Birth weight (in grams) | 2513 ± 510 (2381.746 to 644.254) |
3238.5 ± 404 (3134.526 to 3342.474) |
P .001 |
| Birth head circumference (in centimetres) | 32.3 ± 1.54 (31.904 to 32.696) |
34.33 ± 1.52 (33.939 to 34.721) |
P .001 |
| 1 minute Apgar | 9.19 ± 0.96 (8.943 to 9.437) |
9.11 ± 1.52 (8.719 to 9.501) |
P .735 |
| 5 minute Apgar | 9.85 ± 0.41 (9.744 to 9.956) |
9.74 ± 0.89 (9.511 to 9.969) |
P .395 |
| Season of birth | Spring 21% Summer 30% Autumn 11% Winter 38% |
Spring 21% Summer 28% Autumn 15% Winter 36% |
P .868 |
| Enrolled in school | 67.24% | 62.1% | P .698 |
| Age of enrolment (in months) | 17.28 ± 11.01 (14.446 to 20.114) |
18.14 ± 11.97 (15.059 to 21.221) |
P .688 |
| Abnormalities in developmental items | 1.72% | 0% | P 1 |
| Prevalence of delays before Battelle test | 0.034 | 0.052 | P 1 |
| Admission to neonatal unit | 19% | 5.2% | P .043 |
| Perinatal complications other than preterm birth | 10.34% | 5.17% | P .490 |
| Health problems in first month of life | 6.9% | 1.8% | P .364 |
| Health problems after 1 month of life | 32.8% | 24.1% | P .411 |
Test results
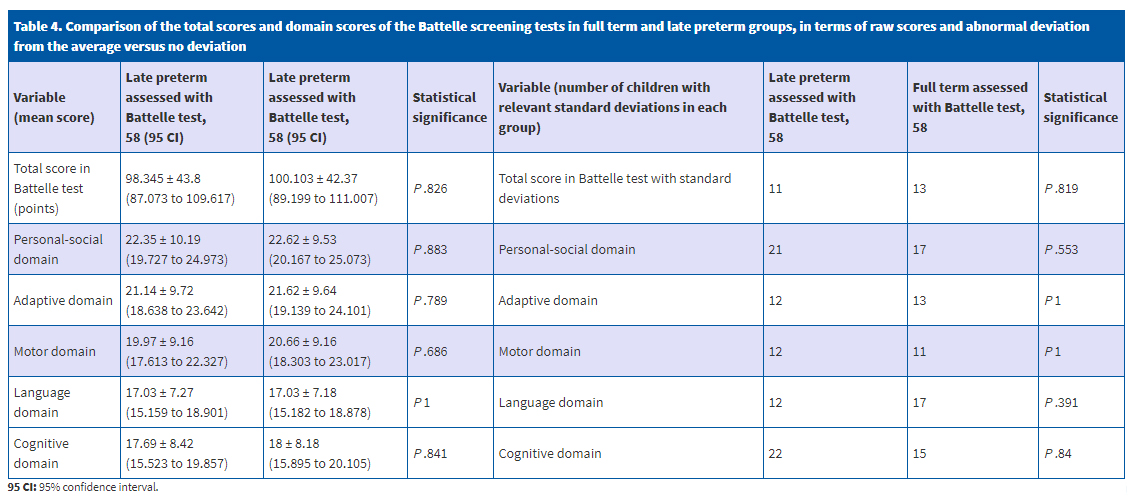
We did not find significant differences between groups in the means of the total score and the developmental domain scores, or in the number of children with relevant deviations from the mean (-1, -1.5 and -2 SDs) versus children without such deviations (Table 4).
| Table 4. Comparison of the total scores and domain scores of the Battelle screening tests in full term and late preterm groups, in terms of raw scores and abnormal deviation from the average versus no deviation | |||||||
|---|---|---|---|---|---|---|---|
| Variable (mean score) |
Late preterm assessed with Battelle test, 58 (95 CI) |
Late preterm assessed with Battelle test, 58 (95 CI) |
Statistical significance | Variable (number of children with relevant standard deviations in each group) | Late preterm assessed with Battelle test, 58 |
Full term assessed with Battelle test, 58 |
Statistical significance |
| Total score in Battelle test (points) | 98.345 ± 43.8 (87.073 to 109.617) |
100.103 ± 42.37 (89.199 to 111.007) |
P .826 | Total score in Battelle test with standard deviations | 11 | 13 | P .819 |
| Personal-social domain | 22.35 ± 10.19 (19.727 to 24.973) |
22.62 ± 9.53 (20.167 to 25.073) |
P .883 | Personal-social domain | 21 | 17 | P .553 |
| Adaptive domain | 21.14 ± 9.72 (18.638 to 23.642) |
21.62 ± 9.64 (19.139 to 24.101) |
P .789 | Adaptive domain | 12 | 13 | P 1 |
| Motor domain | 19.97 ± 9.16 (17.613 to 22.327) |
20.66 ± 9.16 (18.303 to 23.017) |
P .686 | Motor domain | 12 | 11 | P 1 |
| Language domain | 17.03 ± 7.27 (15.159 to 18.901) |
17.03 ± 7.18 (15.182 to 18.878) |
P 1 | Language domain | 12 | 17 | P .391 |
| Cognitive domain | 17.69 ± 8.42 (15.523 to 19.857) |
18 ± 8.18 (15.895 to 20.105) |
P .841 | Cognitive domain | 22 | 15 | P .84 |
However, when we analysed the deviations overall, we found 5 children born to term versus 1 born preterm with scores at -2 SDs, 7 born preterm versus 5 born to term with scores at -1 SD, and 3 children in each group with scores at -1.5 SD. Having found this, we categorised the children in each group based on whether their score was at -2, -1.5, -1 SD or did not signal developmental abnormalities. We then compared preterm and term children in each deviation category, and found that the differences were due to chance, as none were statistically significant between the two groups (P = .206 for -2 SDs, P = 1 for -1.5 SD and P = .762 for -1 SD).
There was no suspicion of psychomotor delay in 14 of the 24 children with relevant deviations (58.3%).
Assuming that the results of the screening test are concordant with those of the full battery, the absolute number and prevalence of delays have increased (0.224 in term children and 0.207 in preterm children). There was only 1 child that did not have developmental abnormalities at the time of the study but had had them in the past, who we counted as a case of delay.
We compared the variables listed in Table 1, classifying children according to whether or not they had a relevant deviation on performing the screening test. Our aim was to identify risk factors, and we found that season of birth and the 1 minute Apgar score were associated with an increased risk of developmental delay (Table 5).
| Table 5. Confounding factors that may be at play in scoring lower than expected in the Battelle test | |||
|---|---|---|---|
| Variable | Children with relevant standard deviations in Battelle test (95 CI) | Children without relevant deviations in the Battelle test (95 CI) | Statistical significance |
| Season of birth | Spring 41.7% Summer 25% Autumn 12.5% Winter 20,8% |
Spring 15.2% Summer 29.3% Autumn 13% Winter 42,4% |
- P .031 - - |
| Apgar 1 minute | 8.65 ± 1.695 (7.934 to 9.366) | 9.28 ± 1.109 (9.053 to 9.507) | P .019 |

DISCUSSION
This study is the first of the kind to be conducted in the Spanish population, comparing developmental delays in children born late preterm versus children born at term by means of the Battelle test.
Contrary to the evidence in the current literature, our study found that psychomotor development was similar in children born preterm compared to their term peers.18-22 We found similar results in children of different ages below 6 years, both in the total score and in the different domains of the test, including the personal-social, adaptive, motor, language and cognitive domains, for chronological as well as corrected age. Our findings are similar to those of the study by Demestre et al (2016), which did not find differences in the total score of the ASQ-3 questionnaire at age 48 months.22
The prevalence of developmental disorders found after screening was very similar in both groups (0.224 in children born at term versus 0.207 in children born preterm). These figures are slightly higher than the prevalence found in a study that assessed the development of children aged 0 to 6 years in Navarre, with delays in 11.2% of the children (prevalence of 0.112), although the prevalence in the latter study referred to actual developmental disorders and did not include mere delays in the achievement of developmental milestones, which may account for the difference between the studies.23 One study conducted in Argentina in the same age group found an unexpectedly high prevalence of 57% (0.57), which may be due to the use of a battery of assessment tools and diagnostic tests over several days to assess for the presence of developmental disorders, as opposed to a single screening test.24 The prevalence in our two samples of patients from Parla fell between the values found in these other two studies.
Our findings allow us to state that in the population of children aged less than 6 years managed in the San Blas Primary Care Centre, those born after 34 weeks’ gestation exhibit a homogeneous pattern of development.
This is not consistent with previous studies performed in the United Kingdom or France with the use of different assessment tools, which have often focused solely on children born extremely preterm (an exclusion criterion in our study) or on other variables.18-22
The prevalence rates found in our study were also inconsistent with those found in the study conducted in Catalonia, which were 0.17 in children born preterm and 0.05 in children born at term.22 The reason for these discrepancies is not clear. On one hand, the sample in the Catalonian study may not be comparable to the sample in our study, as the former excluded children that were admitted to the neonatal unit from the group of children born to term.22 Also, children in the Catalonian study were tested between ages 45 and 50 months and 30 days, unlike our study, where the test could be performed at any age less than 6 years, so that the former may have missed delays that occurred but resolved prior to testing or developmental problems with later onsets that would manifest after testing. It is also possible that the level of development was not judged similarly due to the use of different tests. It is also worth noting that tests were also administered differently, as it was the parents that completed the questionnaire in the Catalonian study, including 7 items with subjective answers, compared to the direct administration of the battery in our study, which is more objective a priori. This could explain the lower prevalence of developmental delays found in the study by Demestre et al (2016), although there does not seem to be a difference in the assessment of development in children aged more than 31 months with the use of the ASQ-3 in the Catalonian study versus the Battelle Developmental Inventory used in our study.25
On the other hand, a study conducted in a primary care centre in Asturias analysed groups of children comparable to those in our study in in terms of descriptive variables such as gestational age, birth weight, sex, perinatal complications and subsequent health problems.26 This study did not find any differences between children born preterm and children born to term in the use of health care resources in terms of number of visits to the paediatrician or nurse, number of referrals to specialists or performance of diagnostic tests,26 which may reflect a similar prevalence and degree of developmental problems, as we found in our study.
In any case, we ought to carefully search for and assess the reasons why children in Parla do not fit the patterns described in most of the studies published to date.
In 58.3% of the cases where developmental delays were identified through screening, there had been no previous suspicion, which confirms that these delays are underdiagnosed. This highlights the need to raise awareness in parents, teachers and paediatricians to adequately address potential developmental problems in each individual, and to include screening for developmental delays as part of the routine care offered to healthy children in outpatient paediatric clinics.
Although the design of our study was not suitable for identifying risk factors for developmental delay other than preterm birth, our findings did corroborate that the 1 minute Apgar score is one of these factors.8
One of the relevant findings of our study was that certain factors, such as socioeconomic status, black race, substance use or infection, were not associated with an increased risk of psychomotor retardation, contrary to other studies.27 It is possible that the design or small sample of our study did not allow for the detection of existing differences.
Another unexpected finding that has not been reported in the literature was the association between developmental delay and season of birth: birth in spring was associated with an increase in suspected developmental delay, and birth in spring with a decreased prevalence of delay.
There is evidence of the importance of seasonality in the development of certain diseases. There are diseases with seasonal patterns, such as respiratory infections, whose incidence increases in winter,28 or diseases that peak in summer (appendicitis, diverticulitis, myocardial infarction, atrial fibrillation); the reason for this variability is not yet understood.29 Along these lines, we propose the hypothesis of a potential association between season of birth and developmental delay.
Previous studies have found an association between preterm birth and season of the year, with contradictory results, although there is no previous evidence of an association of birth season with developmental delay. For instance, in some regions, such as Japan, there is an increased incidence of preterm birth in summer and winter.30 In Africa, preterm birth is more frequent in July and October.31 Other studies have found an association of preterm birth with the start of the dry season in Zimbabwe, autumn in Bangladesh, or winter in London.32 Yet others have found associations with factors such as maternal age or race.33 Our study did not corroborate any of these associations.
It remains to be determined whether there is a seasonal pattern in developmental delay and whether it depends on the population, birth during spring, or variables associated with the spring that could have been identified through multivariate analysis in a larger sample.
Despite the careful design of the study, there are certain limitations that need to be considered in interpreting its results. First of all, the arbitrary definition of ±3.5 months as a clinically relevant difference used in the sample size calculation does not have the same meaning at different ages. A 3.5-month delay in development is not the same at age 3 months and age 3 years. However, specific standard deviations have been provided for each age group for the Battelle screening test, which would correct this potential bias.
On the other hand, given that we conducted a descriptive study without the intent to extrapolate its findings to the general population, we did not consider whether the matched controls were representative of the general population, even though we did compare our results with the existing literature. However, the narrow 95% confidence intervals found in our study would make our findings valid for populations of similar characteristics. Only the time of school enrolment had a slightly wide confidence interval of 6 months for both groups. The rest of the variables were within narrow bounds.
Last of all, our study did not differentiate between children born preterm with a history of perinatal complications associated with a greater risk of developmental delays (perinatal hypoxia, periventricular haemorrhage, etc) versus children born preterm that did not, and did not consider other factors that may lead to developmental delays independently of gestational age. However, we did collect data on these aspects in the questionnaire, although given the sample size and design of the study, we were unable to obtain significant data on these confounding variables.
CONCLUSIONS
In conclusion, our study did not find differences in the prevalence of developmental delays between children born to term (0.224) and children born late preterm (0.207). Since developmental delays had not been suspected in more than 50% of the children in whom screening found some degree of delay, our study evinces the need to implement protocols for the assessment of psychomotor delay within the routine wellness checkup programme.
CONFLICTS OF INTEREST
The authors have no conflicts of interest to declare in relation to the preparation and publication of this article.
ACKNOWLEDGMENTS
We thank all the young patients and their families that participated in the study for their disinterested collaboration.
REFERENCES
- Martínez Gertner M. Eficacia de una breve intervención temprana basada en la evaluación del desarrollo del neonato prematuro: efecto sobre el estrés, la depresión y las percepciones maternas [doctoral thesis]. In: Universitat Autònoma de Barcelona [online] [accessed 03/04/2018]. Available at www.tdx.cat/bitstream/handle/10803/32092/mmg1de1.pdf;jsessionid=B5E0D176D4825FD8F37940D2FCF9DD1A.tdx1?sequence=1
- Tosca Segura R. Prematuros extremos: ¿es posible establecer un límite de viabilidad? Anales (Reial Acadèmia de Medicina de la Comunitat Valenciana). 2011;12:1-20.
- Hurtado Suazo JA, García Reymundo M, Calvo Aguilar MJ, Ginovart Galiana G, Jiménez Moya A, Trincado Aguinagalde MJ, et al. Recomendaciones para el manejo perinatal y seguimiento del recién nacido prematuro tardío. An Pediatr (Barc). 2014;81:327.e1-327.e7.
- De Jong M, Verhoeven M, van Baar AL. School outcome, cognitive functioning, and behaviour problems in moderate and late preterm children and adults: a review. Sem Fetal & Neonatal Med. 2012;17:163-9.
- Pallás Alonso CR, Grupo PrevInfad/PAPPS Infancia y Adolescencia. Actividades preventivas y de promoción de la salud para niños prematuros con una edad gestacional menor de 32 semanas o un peso inferior a 1500 g. Del alta hospitalaria a los siete años (1.ª parte). Rev Pediatr Aten Primaria. 2012;14:153-66.
- Contreras MM. Clasificaciones diagnósticas de los trastornos del desarrollo. In: Lejarraga H. Desarrollo del niño en contexto. Buenos Aires: Paidós SAICF; 2004. p. 143-92.
- Lira MI. Factores de riesgo para el desarrollo psicomotor del lactante de nivel socioeconómico bajo. Rev Chil Pediatr. 1994;65:21-7.
- Ramos Sánchez I. Detección y diagnóstico precoz de los trastornos del desarrollo psicomotor. Vox Paediatrica. 2007;15:36-43.
- Guillois B, Castel S, Beunard A, Blaizot X, Creveuil C, Proia-Lelouey N. Efficacité des programmes d’intervention précoce auprès des familles sur le développement neuro-comportemental des enfants prématurés. Arch Pédiatrie. 2013;20:132-3.
- Moraleda Barreno E, Romero López M, Cayetano Menéndez MJ. La prueba de cribado del inventario de desarrollo de Battelle para la detección precoz de alteraciones del desarrollo. An Pediatr (Barc). 2011;75:372-9.
- Hervada X, Naveira G, Santiago MI, Mujica OJ, Vázquez E, Manrique R, et al. Epidat: programa para análisis epidemiológico de datos. Versión 4.1, octubre 2014. In: Xunta de Galicia [online] [accessed 03/04/2018]. Available at www.sergas.gal/Saude-publica/EPIDAT
- Casado Sánchez ML. Prematuros tardíos vs a término ¿hay diferencias en cuanto a retrasos del desarrollo? In: Google Forms [online] [actualizado el 07/07/2015; consultado el 03/04/2018]. Available at http://goo.gl/forms/16bKHCx2hB
- Newborg J, Stock J, Wnek L. Inventario de desarrollo Battelle. Madrid: TEA; 1996.
- Glascoe FP, Martín ED, Humphrey S. A comparative review of developmental screening tests. Pediatrics. 1990;86:547-54.
- Glascoe FP, Byrne KE. The usefulness of the Battelle Developmental Inventory Screening Test. Clin Pediatr (Phila). 1993;32:273-80.
- Berls AT, McEwen IR. Battelle Developmental Inventory. Phys Ther. 1999;79:776-83.
- Glascoe FP. Are overreferrals on developmental screening tests really a problem? Arch Pediatr Adolesc Med. 2001;155:54-9.
- Snider L, Majnemer A, Mazer B, Campbell S, Bos AF. Prediction of motor and functional outcomes in infants born preterm assessed at term. Pediatr Phys Ther. 2009;21:2-11.
- De Kieviet JF, van Elburg RM, Lafeber HN, Oosterlaan J. Attention problems of very preterm children compared with age-matched term controls at school-age. J Pediatr. 2012;161:824-9.
- Brémond M, Blond MH, Chavet-Queru MS, Hémar I, Miret S, Lionnet C, et al. Devenir médical, psychologique et affectif à l’âge d’un an des prématurés indemnes de handicap sévère. Étude prospective cas-témoins. Arch Pédiatr. 1999;6:1163-71.
- Blond MH, Castello-Herbreteau B, Ajam E, Lecuyer AI, Fradet A, Patat C, et al. Devenir médical, cognitif et affectif à l’âge de quatre ans des prématurés indemnes de handicap sévère. Étude prospective cas-témoins. Arch Pédiatr. 2003;10:117-25.
- Demestre X, Schonbaut L, Morillas J, Martínez-Nadal S, Vila C, Raspall F, et al. Riesgo de déficits en el desarrollo en los prematuros tardíos: evaluación a los 48 meses mediante el Ages & Stages Questionnaires®. An Pediatr (Barc). 2016;84:39-45.
- Álvarez Gómez MJ, Soria Aznar J, Galbe Sánchez-Ventura J, Grupo de Pediatría para el Desarrollo de la Asociación Española de Pediatría de Atención Primaria. Importancia de la vigilancia del desarrollo psicomotor por el pediatra de Atención Primaria: revisión del tema y experiencia de seguimiento en una consulta en Navarra. Rev Pediatr Aten Primaria. 2009;11:65-87.
- Pascucci MC, Lejarraga H, Kelmansky D, Álvarez M, Boullón M, Breiter P, et al. Validación de la prueba nacional de pesquisa de trastornos de desarrollo psicomotor en niños menores de 6 años. Rev Chil Pediatr. 2004;75:75-6.
- Rubio-Codina M, Araujo MC, Attanasio O, Grantham-McGregor S. Validez concurrente y viabilidad de pruebas cortas comúnmente usadas para medir el desarrollo infantil temprano en estudios a gran escala: metodología y resultados. In: Banco Interamericano de Desarrollo [online] [accessed 03/04/2018]. Available at https://publications.iadb.org/handle/11319/7823?locale-attribute=es&
- López Martínez A, Mantecón Fernández L, González Álvarez CE, Arias Llorente RP. Consumo de recursos sanitarios en Atención Primaria de los prematuros tardíos. Estudio caso-control en un centro de salud urbano [scientific letter]. An Pediatr (Barc). 2015;83:213-5.
- Álvarez Mingorance, P. Morbilidad y secuelas de los niños prematuros en edad escolar [doctoral thesis]. In: Universidad de Valladolid [online] [accessed 03/04/2018]. Available at http://uvadoc.uva.es/handle/10324/113
- Llor C, Hernández S. Enfermedad infecciosa en Atención Primaria: estudio prospectivo efectuado durante todo un año. Enferm Infecc Microbiol Clin. 2010;28:222-6.
- Guerrero Guerrero VH. Diverticulitis. Cambiando los paradigmas en el tratamiento. Cir
Gen. 2013;35:S41-2. - Matsuda S, Kahyo H. Seasonality of preterm births in Japan. Int J Epidemiol. 1992;21:91-100.
- Rayco-Solon P, Fulford AJ, Prentice AM. Differential effects of seasonality on preterm birth and intrauterine growth restriction in rural Africans. Am J Clin Nutr. 2005;81:134-9.
- Lee SJ, Steer PJ, Filippi V. Seasonal patterns and preterm birth: a systematic review of the literature and an analysis in a London-based cohort. BJOG. 2006;113:1280-8.
- Cooperstock M, Wolfe RA. Seasonality of preterm births in the collaborative perinatal project: demographic factors. Am J Epidemiol. 1986;124:234-41.