
Vol. 27 - Num. 108
Original Papers
Adherence to recommendations in the diagnosis of urinary tract infection: a multicenter study
Josefa Ares Álvareza, M.ª Eulalia Muñoz Hiraldob, M.ª Rosa Albañil Ballesterosc, M.ª José Martínez Chamorrod, Ana Cubero Santose, Beatriz Morillo Gutiérrezf, Rafael Jiménez Alésg
aPediatra. CS Virgen Peregrina. Pontevedra. España .
bCS Doctor Castroviejo. Madrid. España.
cPediatra. CS Cuzco . Fuenlabrada. Madrid. España.
dPediatra. CS Polanco. Polanco. Cantabria. España.
ePediatra. CS San Roque. Badajoz. España.
fServicio de Pediatría. Hospital de Riotinto. Minas de Riotinto. Huelva. España.
gPediatra. CS José Gallego Arroba. Puente Genil. Córdoba. España.
Correspondence: J Ares. E-mail: finaares@gmail.com
Reference of this article: Ares Álvarez J, Muñoz Hiraldo ME, Albañil Ballesteros MR, Martínez Chamorro MJ, Cubero Santos A, Morillo Gutiérrez B, et al. Adherence to recommendations in the diagnosis of urinary tract infection: a multicenter study . Rev Pediatr Aten Primaria. 2025;27:371-83. https://doi.org/10.60147/8cb9014a
Published in Internet: 25-11-2025 - Visits: 6386
Abstract
Introduction: pediatric urinary tract infection (UTI) should be diagnosed based on compatible symptoms and a positive urine culture obtained using an appropriate technique, although diagnostic errors are common.
Objective: to analyze diagnostic inadequacy in UTI according to the recommendations of the 2019 Spanish guideline.
Material and methods: a prospective, multicenter observational study was conducted in Spain between October 2019 and December 2020. A total of 206 primary care pediatricians recorded episodes of suspected UTI in their assigned patients.
Results: of the 1506 recorded episodes, 1402 were valid: 1212 (86.4%) were adequately diagnosed and 190 (13.6%) were inadequate (p<0.001). Causes of inadequacy included urine culture from an inappropriate sample (37.4%), diagnosis without urine culture (31.6%), incorrect interpretation of CFU/ml (26.8%), and underdiagnosis (4.2%). The use of urine collection bags in children under two years, particularly in primary care compared with hospital emergency departments (66.7% vs 21.7%; p=0.005), and the absence of urine culture in children aged six years or older compared with those aged two to five years (33.9% vs 66.1%; p=0.015) were associated with higher inadequacy. Hematuria (4.7% vs 11.1%; p=0.001), weight loss (2.4% vs 5.8%; p=0.016), and leukocyte esterase (42.8% vs 53.6%; p=0.009) were also associated with greater diagnostic error. Follow-up urine cultures were more frequent in inadequately diagnosed cases (39.0% vs 26.5%; p=0.002), and 23.6% of antibiotic treatments were unnecessarily maintained.
Conclusions: a total of 13.6% of suspected UTI did not meet diagnostic recommendations, resulting in 23.6% of unnecessary antibiotic treatments. These findings underscore the need to strengthen evidence-based practices, particularly regarding urine sample collection, microbiological confirmation, and interpretation of culture results.
Keywords
● Antibacterial agents ● Diagnostic errors ● Guideline adherence ● Overtreatment ● Urinary tract infection ● Urine culture ● Urine specimen collectionINTRODUCTION
Urinary tract infection (UTI) in the pediatric age group poses a clinical, diagnostic and therapeutic challenge, particularly in the primary care (PC) setting (PC).1
Its definition requires the combination of two key elements: the presence of compatible symptoms and confirmation by a positive urine culture. This must be performed on a urine sample collected using adequate technique to minimize the risk of contamination and ensure the validity of the result.1-3
From an epidemiological perspective, the prevalence of UTIs varies considerably according to age and sex. In infants aged less than one year, it is higher in boys (3.7%) compared to girls (2%). This trend is reversed in school-aged children, with a prevalence of 3% in girls and 1% in boys.4 Here are also risk factors (RFs) that increase susceptibility to UTIs, including bladder and bowel dysfunction, congenital abnormalities of the urinary system such as vesicoureteral reflux and, in boys, phimosis.5,6
Diagnosis in children younger than two years is particularly complicated due to the nonspecificity of symptoms (fever without source, irritability, vomiting) and the difficulty in obtaining adequate urine samples, which often requires invasive methods1,5,6 Although the urine dipstick test (UDT) is useful for screening, urine culture is required for definitive diagnosis.1,6-9
An adequate approach to diagnosis is of the essence. On one hand, a high level of suspicion and early antibiotherapy are key for reducing the risk of renal scarring, especially in febrile infants.1,10 Overdiagnosis leads to prescribing of unnecessary antibiotherapy, which promotes the development of bacterial drug resistance, and performance of diagnostic tests that place an additional burden on the patient and the health care system.11,12 Moreover, the variation between clinical guidelines results in substantial heterogeneity in the diagnostic approach.1,13-15
We conducted a study with the primary objective of assessing the appropriateness of the diagnostic approach to episodes of suspected ITU in pediatric care in Spain in reference to the Recommendations on the Diagnosis and Treatment of Urinary Tract Infection of 20193 and the Clinical Practice Guideline on Urinary Tract Infection in the Pediatric Population of 20112, which was the current guideline in Spain at the time the new recommendations were published.
As a secondary objective, we sought to identify the most frequent errors in the diagnostic process and measure the impact of these inappropriate practices in terms of the use of antibiotics and the performance of a follow-up urine culture (UCf/u).
MATERIAL AND METHODS
Nationwide multicenter, prospective and observational study conducted from October 2019 to December 2020.
The study universe consisted of children aged 0 to 15 years with manifestations suggestive of UTI (Table 1), managed in different care settings and followed up in PC pediatrics clinics. A total of 206 PC pediatricians selected at random and practicing throughout Spain (with representation of 16 autonomous communities) collaborated on a voluntary basis and documented the episodes of suspected ITU in their caseloads.
| Table 1. Criteria for definition of clinically significant bacteriuria based on the Recommendations on the Diagnosis and Management of Urinary Tract Infection document of 20193 and clinical manifestations associated with urinary tract infection in children6 | ||||
|---|---|---|---|---|
| Collection technique | Colony count (UFC/mL) | |||
| Suprapubic aspiration | Any | |||
| Urinary catheterization | ≥10 000 | |||
| Clean catch urine | ≥100 000. Considerer 10 000-50 000 if there is a high probability of urinary tract infection (fever + pyuria/bacteriuria or in patients with renal disease) | |||
| Clinical manifestations | ||||
| Age groups | More frequent ↔-------------↔ Less frequent | |||
| Age <3 months |
|
|
|
|
| Age >3 months | Preverbal (<2 years) |
|
|
|
| Verbal(>2 years) |
|
|
|
|
| CFU: colony-forming units. | ||||

The exclusion criteria were: episode of UTI for which follow-up was not possible, case outside the caseload of the provider, lack of informed consent.
We collected anonymized data for providers, patients and episodes by means of an online form. Each collaborating pediatrician entered the data on the clinical characteristics and management of the episodes. Providers were also asked to confirm or rule out the initial suspected diagnosis of UIT based on their clinical judgment and the available test results.
Subsequently, the research team classified each episode as “appropriately diagnosed episode” (ADE) if it met the microbiological criteria of the 2019 recommendations (Table 1) along with compatible symptoms3 (Table 1) or “inappropriately diagnosed episode” (IDE) otherwise. Inappropriately diagnosed episodes were further classified into four subgroups for more detailed analysis (Figure 1):
| Figure 1. Flow chart of the study |
|---|
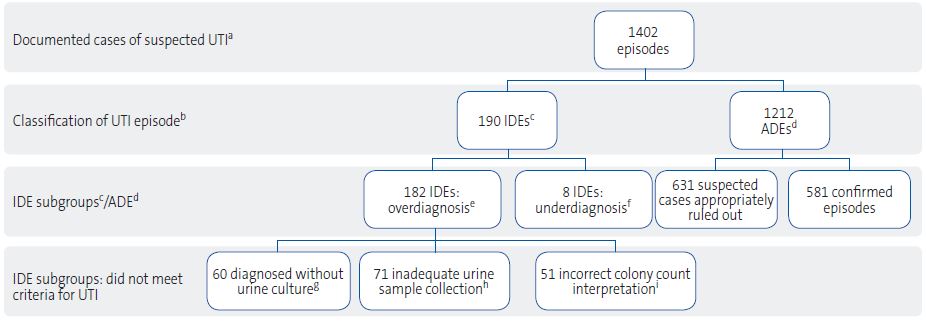 |
|
aUTI: urinary tract infection. bThe researchers applied the criteria recommended in the 2019 Spanish guideline3 to assess the appropriateness of diagnosis: clinical manifestations, risk factors, urinalysis results and urine culture results. cIDE: inappropriately diagnosed episode on account of not meeting one or more of the criteria. dADE: appropriately diagnosed episode based on meeting the criteria to either confirm or rule out UTI. eIDE (OVERDIAGNOSIS): UTI episodes diagnosed by participating pediatricians in which diagnosis did not adhere to the criteria established in the 2019 guideline.3 fIDE (UNDERDIAGNOSIS): episodes that met the criteria for UTI but not diagnosed as UTI by participating pediatricians. gEPISODES DIAGNOSED WITHOUT URINE CULTURE: diagnosis based solely on clinical and/or laboratory criteria (dipstick or conventional urinalysis). hEPISODES WITH INADEQUATE SAMPLE COLLECTION: urine culture was performed, but using specimens obtained from a urine collection bag in incontinent children. iEPISODES WITH INCORRECT INTERPRETATION OF COLONY COUNTS: urine culture was performed, but the interpretation of colony counts (CFU/mL) did not adhere to the criteria established in the 2019 guideline.3 |

- Episodes with inadequate sample collection: urine collected in a bag in an incontinent child.
- Episodes diagnosed without urine culture: diagnosis based on clinical manifestations, with or without urinalysis (conventional urinalysis or UDT), without microbiological confirmation.
- Episodes with inadequate interpretations of colony counts: the interpretation of the concentration of colony forming units (CFU/mL) did not meet the criteria for significant bacteriuria according to the specimen collection method.
- Underdiagnosis: cases that met the criteria for UTI but were not confirmed as such by the collaborating pediatrician.
We analyzed different variables: demographic and professional characteristics of pediatricians, clinical and demographic characteristics of patients, characteristics of UTI episodes and their temporal distribution to assess the potential impact of the COVID-19 pandemic on inappropriate diagnosis. We also analyzed the ordering of UCf/u and the use of antibiotherapy in IDEs. We compared IDEs and IDE subgroups with ADEs for those variables found to be statistically significant and to have an impact in the study.
The study was approved by the Ethics Committee of the Hospital Universitario de Fuenlabrada, Madrid, (APR 19/03). Patients were included after obtaining informed consent from the parents/legal guardians and assent from patients aged more than 12 years.
The statistical analysis was carried out with the software JASP 0.19.3, summarizing continuous variables as mean or median with the corresponding dispersion statistic (standard deviation or interquartile range). Categorical variables were expressed as absolute frequencies and percentages. We made comparisons by means of the χ2 test and Fisher exact test (dichotomous variables). We calculated odds ratios (ORs) with the corresponding 95% confidence interval (95 CI) and p values for the Fisher exact test in the analysis of the association between variables.
RESULTS
We obtained a total of 1506 episode records, of which 1402 were considered valid for analysis (Figure 1). Of these total, 190 (13.6%) were classified as IDEs and 1212 (86.4%) as ADEs (p <0.001).
The distribution of the reason for classifying an episode as an IDE was as follows (Table 2.1): use of an inadequate specimen, the most frequent error, due to collection in a urine bag (37.4%); following in frequency, diagnosis without urine culture (31.6%), incorrect interpretation of the colony count (26.8%) and, less frequently, underdiagnosis (4.2%).
| Table 2.1. Association of inappropriate diagnosis with provider-related and care setting characteristics | |||||||||
|---|---|---|---|---|---|---|---|---|---|
| EAD | EID | p | IDE (inadequate specimen)a | p | IDE (no urine culture) | p | IDE (colony count)b | p | |
| EPISODES, n (%) | 1212 (86.4) | 190 (13.6) | <0.001 | 71 (37.4) | 60 (31.6) | 51 (26.8) | |||
| SEXc | |||||||||
| Female | 1139 (94.1) | 170 (89.5) | 0.026 | 53 (88.3) | 0.092 | 40 (78.4) | <0.001 | ||
| Male | 72 (5.9) | 20 (10.5) | 7 (11.7) | 11 (21.6) | |||||
| Femaled | 251 (57.8) | 40 (56.3) | <0.001 | ||||||
| Maled | 183 (42.2) | 31 (46.7) | |||||||
| GEOGRAPHICAL SETTING | |||||||||
| Rural care setting | 324 (26.7) | 52 (27.37) | 0.860 | 20 (28.2) | 0.235 | 21 (35.0) | 0.160 | 8 (15.7) | 0.079 |
| Urban care setting | 888 (73.3) | 138 (72.63) | 51 (71.8) | 39 (65.0) | 43 (84.3) | ||||
| WORK EXPERIENCE | |||||||||
| >20 years | 758 (62.6) | 125 (65.8) | 0.314* | 43 (84.3) | 0.904* | 47 (78.3) | 0.043* | 30 (58.8) | 0.076* |
| 11-20 years | 312 (25.8) | 49 (25.8) | 20 (28.2) | 8 (13.3) | 19 (37.2) | ||||
| <11 years | 141 (11.7) | 16 (8.4) | 8 (11.3) | 5 (8.3) | 2 (4.0) | ||||
| >20 years (male providers) | 44 (71.0) | 18 (94.7) | 0.034 | ||||||
| <11 years (male providers) | 18 (29.0) | 1 (5.3) | |||||||
| SETTING WHERE UTI WAS SUSPECTED | |||||||||
| Episodes in rPC | 827 (91.0) | 119 (76.3) | <0.001 | 32 (54.2) | <0.001 | 30 (66.2) | <0.001 | ||
| Episodes en uPC | 82 (9.0) | 37 (23.7) | 27 (45.8) | 14 (31.8) | |||||
| Episodes in incontinent Pts in rPC | 254 (94.1) | 54 (96.4) | 0.748 | ||||||
| Episodes in incontinent Pts in uPC | 16 (5.9) | 2 (3.69) | |||||||
| Episodes in rPC | 827 (73.2) | 119 (77.8) | 0.241 | 32 (97.0) | <0.001 | 30 (61.1) | 0.347 | ||
| Episodes in hED | 303 (26.8) | 34 (22.2) | 1 (3.0) | 7 (18.9) | |||||
| Episodes in incontinent Pts in rPC | 254 (60.6) | 54 (66.7) | 0.005 | ||||||
| Episodes in incontinent Pts in hED | 165 (39.4) | 15 (21.7) | |||||||
| ADE: appropriately diagnosed episode; hED: hospital-based emergency department; IDE: inappropriately diagnosed episode; Pt: patient; rPC: routine primary care; uPC: urgent primary care. *P value obtained in χ2 test. aIDE due to inadequate sample collection. bIDE due to incorrect interpretation of colony count (CFU/mL). cSex not documented in one episode. dLimited to the group of providers (male and female) who documented episodes in incontinent patients. | |||||||||

Factors associated with inappropriate diagnostic practices
Analysis by provider-related characteristics and care setting (Table 2.1)
Male providers, and particularly those with more than 20 years’ experience, reported a significantly higher proportion of IDEs (95% vs. 71%; p 0.034; OR: 6.44; 95 CI: 1.18 to 4.18; p = 0.034) and of diagnosis without urine culture (OR: 2.14; 95 CI: 1.18 to 4.18; p = 0.013) (Table 2.2).
| Tabla 2.2. Odds ratios for IDE/ADE in relation to provider characteristics | ||||
|---|---|---|---|---|
| Variable | OR | LCL95 | UCL95 | p |
| Provider sex | 0.54 | 0.32 | 0.92 | 0.026 |
| Work setting: rural/urban | 0.91 | 0.30 | 2.53 | 1.000 |
| Caseload <1000 patients/≥1000 patients | 1.11 | 0.81 | 1.51 | 0.523 |
| Work experience: >20 years/<11 years | 1.22 | 0.71 | 2.25 | 0.581 |
| Work experience (male providers): >20 years/<11 years | 6.44 | 1.17 | 163.03 | 0.034 |
| Work experience (IDE due to no urine culture): >20 years/<20 years | 2.14 | 1.18 | 4.18 | 0.013 |
| IDE/ADE: inappropriately diagnosed episodes/appropriately diagnosed episodes; LCL95: upper bound of 95% confidence interval; UCL95: upper bound of 95% confidence interval. | ||||

As regards the care setting (Table 2.1), inappropriate diagnosis was significantly less frequent in routine PC (rPC) compared to urgent primary care (uPC) services (OR: 0.32; 95 CI: 0.21 to 0.50; p <0.001) (Table 2.3).
| Table 2.3. Odds ratios for IDE/ADE based on care setting | |||||
|---|---|---|---|---|---|
| Variable | OR | LCL95 | UCL95 | p | |
| IDE/ADE | rPC/uPC | 0.32 | 0.21 | 0.50 | 0.0001 |
| hED/rPC | 1.28 | 0.86 | 1.94 | 0.241 | |
| Incontinent patients: inadequate specimen/ADE | rPC/uPC | 1.60 | 0.43 | 11.20 | 0.748 |
| rPC/hED | 2.32 | 1.29 | 4.40 | 0.005 | |
| No urine culture/ADE | uPC/rPC | 8.51 | 4.86 | 14.90 | 0.0001 |
| rPC/hED | 10.28 | 2.22 | 243.39 | 0.0001 | |
| Wrong colony count interpretation/ADE | rPC/uPC | 0.21 | 0.11 | 0.43 | 0.0001 |
| rPC/hED | 1.54 | 0.71 | 3.90 | 0.347 | |
| hED: hospital-based emergency department; IDE/ADE: inappropriately diagnosed episodes/appropriately diagnosed episodes; LCL95: lower bound of 95% confidence interval; rPC: routine primary care; uPC: urgent primary care; UCL95: upper bound of 95% confidence interval. | |||||

In the separate analysis of episodes in patients without bladder control, the frequency of inappropriate diagnosis was greater in rPCs compared to hospital-based emergency departments (hEDs) on account of episodes with inadequate urine specimens (OR: 2.32; 95 CI: 1.29 to 4.40; p = 0.005) (Table 2.3).
The proportion of inappropriate diagnosis due to failure to do the lack of urine culture was significantly greater among episodes suspected in the uPC vs. the rPC setting (OR: 8.51; 95 CI: 4.86 to 14.90; p = 0.0001) (Table 2.3).
When it came to IDEs on account of incorrect interpretation of colony counts, the proportion was lower in the group of episodes suspected in the rPC vs. the uPC setting (OR: 0.21; 95 CI: 0.11 to 0.43; p = 0.0001) (Table 2.3).
Analysis by patient- and episode-related characteristics (Table 3)
| Table 3. Patient-related characteristics in the total episodes documented by participating providers | |||||||||
|---|---|---|---|---|---|---|---|---|---|
| ADE | IDE | p | IDE (inadequate specimen)a | p | IDE (no urine culture) | p | IDE (colony count)b | p | |
| EPISODES, n (%) | 1212 (86.4) | 190 (13.6) | <0.001 | 71 (37.4) | 60 (31.6) | 51 (26.8) | |||
| PATIENT AGE | |||||||||
| Mean (SD) (years) | 4,7 (3.9) | 5,7 (3.0) | 0.8 (0.6) | 7.5(3.3) | 6.1 (4.4) | ||||
| Median (IQR) (years) | 3.9 (6.3) | 6.9 (4.4) | 0.7 (0.6) | 7.8 (3.5) | 4.7 (6.1) | ||||
| <24 months | 400 (33.0) | 78 (41.0) | 0.032 | 68 (95.8) | 0.337 | 1 (1.7) | <0.001 | 9 (17.6) | 0.022 |
| ≥24 months | 812 (67.0) | 112 (59.0) | 3 (4.2) | 59 (98.3) | 42 (82.4) | ||||
| 2-5 years | 414 (50.9) | 45 (40.2) | 0.034 | 20 (33.9) | 0.015 | 19 (45.2) | 0.528 | ||
| ≥6 years | 398 (49.0) | 67 (59.8) | 39 (66.1) | 23 (54.8) | |||||
| 2-5 years (female) | 334 (50.2) | 18 (34.0) | 0.031 | ||||||
| ≥6 years (female) | 331 (49.8) | 35 (66.0) | |||||||
| PATIENT SEXc | |||||||||
| Female | 886 (73.2) | 140 (73.7) | 0.930 | 53 (88.3) | 0.010 | 40 (78.4) | 0.518 | ||
| Male | 324 (26.8) | 50 (26.3) | 7 (11.7) | 11 (21.6) | |||||
| Incontinent female Pts | 251 (57.8) | 40 (56.3) | 0.897 | ||||||
| Incontinent male Pts | 183 (42.2) | 31 (43.7) | |||||||
| INCONTINENCE | |||||||||
| Yesd | 435 (36.6) | 83 (43.7) | 0.052 | 71 (100) | 4 (6.7) | <0.001 | 8 (15.7) | 0.002 | |
| No | 768 (63.4) | 107 (56.3) | - | 56 (93.3) | 43 (84.3) | ||||
| EPISODE NUMBER | |||||||||
| 1st episode | 1059 (87.3) | 153 (80.5) | 0.016 | 51 (85.0) | 0.553 | 43 (84.3) | 0.519 | ||
| ≥2nd episodie | 153 (12.6) | 37 (19.5) | 9 (15.0) | 8 (15.7) | |||||
| 1st episode in incontinent Pt | 388 (89.2) | 54 (76.1) | 0.004 | ||||||
| ≥2nd episode in incontinent Pt | 47 (10.8) | 17 (23.9) | |||||||
| ADE: appropriately diagnosed episode; IDE: inappropriately diagnosed episode; Pt: patient. aIDE due to inadequate sample collection. bIDE due to incorrect interpretation of colony count (CFU/mL). cSex not documented in two episodes. dTotal number of incontinent patients: 506. | |||||||||

Inappropriate diagnosis due to inadequate urine specimens was associated with a younger mean age while inappropriate diagnosis due to lack of urine culture was associated with older age.
Inappropriate diagnosis was most frequent among children aged less than 24 months. In 14% of episodes in incontinent children in whom UTI was ruled out, the reason for IDE classification was an inadequate specimen (71 out of 505; Table 4). On the other hand, diagnosis without urine culture was more common in children aged 6 years or older compared to those aged 2 to 5 years, a difference that was statistically significant (66.1% vs. 33.9%; p = 0.015) (Table 3).
| Table 4. Patient incontinence and risk factors for the total documented episodes | ||||||||||
|---|---|---|---|---|---|---|---|---|---|---|
| RISK FACTORS, n (%) | ADE | IDE | p | IDE (inadequate specimen)a | p | IDE (no urine culture) | p | IDE (colony count)b | p | |
| Yes | 455 (37.6) | 79 (41.6) | 0.297 | 20 (33.3) | 0.585 | 30 (58.8) | 0.659 | |||
| Yes, in incontinent Pts with nonpathological resultsc | 263 (60.5) | 40 (56.3) | 0.517 | |||||||
| Labial adhesions (girls) | 19 (1.7) | 2 (1.4) | 0.756 | 2 (5.0) | 0.229 | |||||
| Phimosis (boys) | 102 (31.5) | 16 (32.0) | 1.000 | 4 (36.4) | 0.747 | |||||
| Phimosis in incontinent boysd | 82 (44.8) | 12 (38.7) | 0.560 | |||||||
| Previous UTI | 253 (20.9) | 50 (26.3) | 0.107 | 17 (28.3) | 0.194 | 13 (25.5) | 0.482 | |||
| Previous UTI in incontinent Ptc | 63 (14.5) | 15 (21.1) | 0.160 | |||||||
| VUR | 50 (4.1) | 6 (3.2) | 0.690 | 1 (2.0) | 0.719 | |||||
| VUR in incontinent Ptc | 23 (5.3) | 4 (5.6) | 0.782 | |||||||
| Other RM | 54 (4.5) | 9 (4.7) | 0.851 | 1 (1.7) | 0.513 | 1 (2.0) | 0.165 | |||
| Other RM in incontinent Ptc | 37 (8.5) | 7 (9.9) | 0.653 | |||||||
| Bladder dysfunction | 40 (3.3) | 1 (0.5) | 0.034 | |||||||
| Constipation-encopresis | 90 (7.4) | 10 (5.3) | 0.362 | 3 (5.0) | 0.618 | 2 (3.9) | 0.578 | |||
| Constipation-encopresis in incontinent Ptc | 13 (3.0) | 2 (2.8) | 1.000 | |||||||
| Hypercalciuria | 3 (0.3) | 3 (1.6) | 0.036 | 2 (3.3) | 0.020 | 1 (2.0) | 0.152 | |||
| ADE: appropriately diagnosed episode; IDE: inappropriately diagnosed episode; Pt: patient; RM: renal malformation; UTI: urinary tract infection; VUR: vesicoureteral reflux. aIDE due to inadequate sample collection. bIDE due to incorrect interpretation of colony count (CFU/mL). cIncontinent patients with nonpathological results in ADE group: 435. dIncontinent boys in ADE group: 183. | ||||||||||

We also found a significantly higher proportion of first episodes in the ADE group (87.3% vs. 80.5%) and of successive episodes in the IDE group (19.5% vs. 12.6%; p = 0.016) (Table 3).
Presence of risk factors
Overall, the presence of RFs was not associated with inappropriate diagnosis (37.6% vs. 41.6%; p = 0.297). However, bladder dysfunction was significantly associated with a lower probability and hypercalciuria with a higher probability of IDE (Table 4).
Analysis based on clinical presentation and performance of urinalysis
Hematuria (4.7% vs. 11.1%; p 0.001), weight loss (2.4% vs. 5.8%; p = 0.016), urinary frequency (27.9% vs. 48.3%; p <0.001), dysuria (48.6% vs. 90%; p <0.001) and urgency (13.2% vs. 25.5%; p = 0.008) were associated with inappropriate diagnosis. On the contrary, fever higher than 38 °C was significantly less frequent in cases of inappropriate diagnosis due to an inadequate specimen in incontinent patients (42.3% vs. 59.5%; p = 0.009) and episodes diagnosed without urine culture (25.3% vs. 5%; p <0.001) (Table 5).
| Table 5. Clinical characteristics of documented episodes | |||||||||
|---|---|---|---|---|---|---|---|---|---|
| CLINICAL MANIFESTATIONS, n (%) | ADE | IDE | p | IDE (inadequate specimen)a | p | IDE (no urine culture) | p | IDE (colony count)b | p |
| Feve >38 °C | 376 (31.0) 259 (59.5)c |
48 (25.3) | 0.126 | 30 (42.3)c | 0.009 | 3 (5.0) | <0.001 | 11 (21.6) | 0.166 |
| Dysuria | 589 (48.6) 39 (9,0)3 |
94 (49.5) | 0.876 | 5 (7.0)c | 0.820 | 54 (90.0) | <0.001 | 31 (60.8) | 0.115 |
| Urinary frequency | 321 (26.5) | 53 (27.9) | 0.724 | 29 (48.3) | <0.001 | 19 (37.3) | 0.106 | ||
| Urinary urgency | 145 (12.0) | 25 (13.2) | 0.633 | 11 (18.3) | 0.156 | 13 (25.5) | 0.008 | ||
| Changes in urine color, odor | 106 (8.8) 34 (7.8)c |
14 (7.4) | 0.675 | 7 (9.9)c | 0.491 | 3 (5.0) | 0.476 | 4 (7.8) | 1.000 |
| Nycturia | 65 (5.4) | 8 (4.2) | 0.601 | 4 (6.7) | 0.562 | 4 (7.8) | 0.356 | ||
| Hematuria | 57 (4.7) 6 (1.4) |
21 (11.1) | 0.001 | 1 (1.4)c | 1.000 | 9 (15.0) | 0.003 | 10 (19.6) | <0.001 |
| Polyuria | 38 (3.1) | 6 (3.2) | 1.000 | 2 (3.3) | 0.713 | 3 (5.9) | 0.227 | ||
| Irritability | 151 (12.5) 126 (29.0)c |
24 (12.6) | 0.906 | 19 (26.8)c | 0.778 | 3 (5.0) | 0.103 | 2 (3.9) | 0.078 |
| Loss of appetite | 131 (10.8) 105 (24.1)c |
28 (14.7) | 0.139 | 23 (32.4)c | 0.143 | 4 (7.8) | 0.646 | ||
| Vomiting | 115 (9.5) 70 (16.1)c |
14 (7.4) | 0.418 | 9 (12.7)c | 0.597 | 5 (9.8) | 0.811 | ||
| Weight loss | 29 (2.4) 26 (6.0)c |
11 (5.8) | 0.016 | 10 (14.1)c | 0.022 | 1 (2.0) | 1.000 | ||
| Abdominal pain | 176 (14.5) 15 (3.4)c |
15 (7.9) | 0.012 | 2 (2.8)c | 1.000 | 6 (10.0) | 0.449 | 4 (7.8) | 0.222 |
| Lumbar pain | 26 (2.1) | 4 (2.1) | 1.000 | 1 (1.7) | 1.000 | 3 (5.9) | 0.108 | ||
| Costovertebral angle tenderness (+) | 15 (1.2) | 2 (1.1) | 1.000 | ||||||
| ADE: appropriately diagnosed episode; IDE: inappropriately diagnosed episode; UTI: urinary tract infection. aIDE due to inadequate sample collection. bIDE due to incorrect interpretation of colony count (CFU/mL). cEpisodes in incontinent patients with nonpathological results; ADE in incontinent patients with nonpathological results: 435. | |||||||||

In respect of UDT results, we ought to highlight that the presence in urine of leukocyte esterase (LE) in absence of nitrites was significantly associated with an increased probability of diagnosis without urine culture (42.8% vs. 58.8%; p = 0.030). When both parameters (LE and nitrites) were negative, the probability of inappropriate diagnosis decreased (32.5% vs. 15.1%; p <0.001) (Table 6).
| Table 6. Results of urinalysis and association with inappropriate diagnosis | |||||||||
|---|---|---|---|---|---|---|---|---|---|
| Dipstick/conventional n (%) | ADE | IDE | p | IDE (inadequate specimen)a | p | IDE (no urine culture) | p | IDE (colony count)b | p |
| Yes, performed | 1146 (94.6) | 166 (87.3) | <0.001 | 51 (100) | 47 (92.2) | 0.524 | |||
| Yes, performed in incontinent Ptsc | 417 (54.3) | 60 (84.5) | 0.001 | ||||||
| N+/LE+ | 217 (18.9) | 43 (25.9) | 0.038 | 15 (29.4) | 0.071 | 7 (14.9) | 0.572 | ||
| N+/LE+ in incontinent Ptsc | 73 (17.5) | 19 (31.7) | 0.014 | ||||||
| N+/LE− | 66 (5.8) | 9 (5.4) | 1.000 | 3 (5.9) | 1.000 | 2 (4.3) | 1.000 | ||
| N+/LE- in incontinent Ptsc | 26 (6.2) | 4 (6.7) | 0.781 | ||||||
| LE+/N− | 491 (42.8) | 89 (53.6) | 0.009 | 30 (58.8) | 0.030 | 29 (61.7) | 0.015 | ||
| LE+/N- in incontinent Ptsc | 162 (38.8) | 25 (41.7) | 0.674 | ||||||
| N−/LE− | 372 (32.5) | 25 (15.1) | <0.001 | 3 (5.9) | <0.001 | 9 (19.1) | 0.057 | ||
| N−/LE− in incontinent Ptsc | 156 (15.1) | 12 (20.0) | 0.009 | ||||||
|
ADE: appropriately diagnosed episode; IDE: inappropriately diagnosed episode; LE: leukocyte esterase; N: nitrite. aIDE due to inadequate sample collection. bIDE due to incorrect interpretation of colony count (CFU/mL). cEpisodes in incontinent patients with nonpathological results; number of incontinent patients with nonpathological results in ADE group: 435 |
|||||||||

Underdiagnosis
We identified 8 cases of missed diagnosis in continent children (Figure 1). The reasons included disregarding the possibility of polymicrobial infection in samples with two isolates (eg: Proteus spp. + Klebsiella spp.), the clinical significance of isolates such as E. faecalis o S. saprophyticus despite compatible symptoms or colony counts that were actually significant in patients with underlying renal disease.
Analysis in relation to the pandemic (Table 7)
| Table 7. Impact of pandemic on inappropriate diagnosis | |||||||||
|---|---|---|---|---|---|---|---|---|---|
| IMPACT OF PANDEMIC n (%) | ADE | IDE | p | IDE (inadequate specimen)a | p | IDE (no urine culture) | p | IDE (colony count)b | p |
| During pandemic | 431 (35.6) | 85 (44.7) | 0.019 | 28 (46.7) | 0.098 | 19 (37.3) | 0.882 | ||
| Before pandemic | 781 (64.4) | 105 (55.3) | 32 (53.3) | 32 (62.7) | |||||
| During pandemic, incontinent patients | 164 (37.7)c | 37 (52.1) | 0.116 | ||||||
| Before pandemic, incontinent patients | 271 (62.3)c | 34 (47.9) | |||||||
| ADE: appropriately diagnosed episode; IDE: inappropriately diagnosed episode. aIDE due to inadequate sample collection. bIDE due to incorrect interpretation of colony count (CFU/mL). cNumber of incontinent patients with nonpathological results in ADE group: 435 | |||||||||

We also assessed the impact of the COVID-19 pandemic on inappropriate diagnosis. We found a higher proportion of IDEs in relation to ADEs during the pandemic (44.7% vs. 35.6%; p = 0.019) compared to the preceding months.
Analysis of management immediately after diagnosis
We considered the ordering of UCf/u, which was more frequent in IDEs compared to ADEs (39% vs. 26.5%; p = 0.002) (Table 8). Furthermore, in 42.3% of IDEs in which culture was performed, the turnaround time exceeded 72 hours. Of the total prescriptions for antibiotics, 23.6% (n = 180) were made in IDEs. Empirical treatment was initiated immediately once UTI was suspected in 80% of cases and had a mean duration of 7.9 ± 2 days. There were no significant differences in duration between IDEs and ADEs (Table 9).
| Table 8. Association between follow-up culture and inappropriate diagnosis | |||||||||
|---|---|---|---|---|---|---|---|---|---|
| FOLLOW-UP CULTURE, n (%) | ADE | IDE | p | IDE (inadequate specimen)a | p | IDE (no urine culture) | p | IDE (colony count)b | p |
| Not performed | 425 (73.5) | 111 (61.0) | 0.002 | 34 (66.7) | 0.324 | 33 (64.7) | 0.190 | ||
| Performed | 153 (26.5) | 71 (39.0) | 17 (33.3) | 18 (35.3) | |||||
| Performed in incontinent Pt | 164 (80.4)c | 35 (49.3) | <0.001 | ||||||
| Not performed in incontinent Pt | 40 (19.6)c | 36 (50.7) | |||||||
| ADE: appropriately diagnosed episode; IDE: inappropriately diagnosed episode; Pt: patient. aIDE due to inadequate sample collection. bIDE due to incorrect interpretation of colony count (CFU/mL). cNumber of incontinent patients with nonpathological results in ADE group: 435. | |||||||||

| Table 9. Urine culture turnaround time and antibiotherapy in inappropriately diagnosed episodes | |
|---|---|
| UC TURNAROUND TIMEa | |
| Episodes with UC results in <48 hours | 4 (3.1%) |
| Episodes with UC results in 48-72 hours | 43 (33.1%) |
| Episodes with UC results in >72 hours | 55 (42.3%) |
| Episodes with unknown turnaround time | 28 (21.5%) |
| EPISODES WITH ABX | |
| Total IDEs managed with ABx | 182 (23.6%)b |
| INITIATION OF ABX | |
| Immediately | 147 (80.8%) |
| Following day | 6 (3.3%) |
| 2 days | 7 (3.8%) |
| 3 days | 3 (1.6%) |
| >3 days | 16 (8,8%) |
| Not documented | 3 (1.6%) |
| DURATION (DAYS) OF ABX (mean ± SD) | |
| Duration in IDEsc | 7.9 ± 2.0 |
| Duration in ADEsc | 6.7 ± 3.1 |
| ABx: antibiotherapy; ADE: appropriately diagnosed episode; IDE: inappropriately diagnosed episode; UC: urine culture.aNumber of IDEs with UC: 130. bTotal ABx prescriptions: 772 (76.4% in ADEs). cNo significant differences in duration between IDEs and ADEs. | |

DISCUSSION
Among the relevant findings of the study, we ought to highlight that in 13.6% of diagnosed episodes of UTI, the diagnostic approach did not adhere to the 2019 recommendations2,3 and that nearly one fourth (23.6 %) of prescribed antibiotherapy regimens were unnecessary. This reflects suboptimal adherence to current clinical practice guidelines (CPGs),3,16 although the frequency of inadequate adherence was lower compared to the figures reported in other studies (53-75%), including studies conducted exclusively in emergency care settings and those that included cases managed at the primary care level.11,12,17-19 The inclusion of PC pediatricians in our case series, which allowed longitudinal follow-up of the patients, could have contributed to the greater adherence.
We found that work experience was associated with significantly lower adherence to recommendations (Tables 2.1 and 2.2). This association is a widely recognized phenomenon in the medical literature. More experienced professionals may be more reluctant to implement new guidelines, particularly if they consider them unclear or inconsistent. These factors may encourage the persistence of previous recommendations, which are deeply ingrained.16,20
The analysis by care setting revealed a higher frequency of inappropriate diagnosis when UTI was suspected in uPC compared to rPC settings. In the latter setting, there was a higher proportion of diagnosis without urine culture and failure to adhere to recommended colony count cut-offs. In the uPC setting, care is usually provided by physicians primarily trained to care for the adult population, which is conducive to the implementation of protocols for adult management and therefore inappropriate diagnosis in pediatric patients.21
However, in our study, the collaborating provider was tasked with making a final diagnosis after evaluating the test results, confirming or ruling out the suspicion. Some errors persisted through this process, probably due to favorable outcomes or because treatment had already been completed. Similarly, studies on misdiagnosis following UTI suspicion showed that in more than half of the cases, antibiotherapy was not discontinued despite ruling out UTI, even based on negative urine culture results.17
In a more detailed analysis of the common errors in diagnosis, two practices stood out:
The first one was the persisting use of urine collection bags for sample collection in incontinent patients (14% 71/506; Table 3). There is ample evidence of the high false-positive rate associated with this sample collection method, which, according to some systematic reviews may be as high as 35-45%22 or even exceed 50%.3 Although bags continue to be used to collect urine samples in the PC setting and even in hospital-based emergency departments due to the simplicity of the method, 23 this practice should be limited to initial screening in low-acuity cases.4,24,25 The fact that 22% of cases of inappropriate diagnosis due to an inadequate sample in incontinent patients occurred in hEDs (Table 2.1) is particularly relevant, given that the human and material resources available in this care setting allow for the use of appropriate specimen collection techniques.19,23
The second one was diagnosis of UTI without performance of urine culture (Table 3). In one third of IDEs, UTI was diagnosed solely based on clinical manifestations with or without urinalysis. The UDT is a useful tool to guide diagnosis and rule out UTI with substantial confidence in pediatric patients, especially those aged more than 3 months.9,26 However, the specificity of leukocyte esterase is low (78%),7,27-30 so its detection can give rise to false positives in patients presenting with manifestations such as fever, dehydration or vulvovaginitis.6 Furthermore, the omission of urine culture chiefly affected patients aged 6 years or older. The high frequency of lower urinary tract symptoms or prepubertal vulvovaginitis in girls, conditions with clinical manifestations that overlap those of UTI, may lead to misinterpretation of these symptoms as indicative of a UTI.17,31 In consequence, microbiological confirmation is required in most common clinical scenarios.1,29,30
The interpretation of clinical factors, together with age, contributes relevant information that is associated with lower adherence to recommendations. In this regard, fever was associated with a higher frequency of appropriate diagnosis, probably because it raises the level of suspicion of a serious bacterial infection, such as pyelonephritis, which promotes more rigorous management and greater adherence to CPGs.16,32 In contrast, less specific symptoms, such as weight loss or hematuria, acted as confounding factors, increasing the frequency of inappropriate diagnosis1,3,30 (Tables 1 and 3).
Determining whether the presence of RFs could have encouraged greater adherence to recommendations is relevant, as RFs can increase the risk or severity of UTI (Table 4). We observed that, overall, the presence of RFs did not significantly change management. Specifically, only bladder dysfunction was associated with more rigorous management, a practice recommended in CPGs because it bladder dysfunction is strongly associated with recurrent infection and kidney injury.1,5,6,33 Hypercalciuria, while infrequent, was associated with a greater probability of inappropriate diagnosis. While hypercalciuria is recognized as a RF for recurrent UTI (up to 20%),34,35 it also can be a source of confusion in the diagnostic process, especially if adherence is suboptimal and appropriate microbiological confirmation is not pursued. Its impact on urinary symptoms and the interpretation of urinalysis findings can promote diagnostic error in the aforementioned situations.34
Another relevant finding was the increased frequency of inappropriate management in successive episodes of UTI compared to first episodes, independently of other risk factors, even when CPGs provided clear recommendations for such scenarios.2,3,5 Current evidence suggests that the tendency toward the inadequate management of additional UTI episodes is mainly due to the habits and fast, reflexive decision-making processes of providers rather than patient-related factors, which favors the repetition of specific medical errors.36
These findings have significant implications. On the one hand, urine culture turnaround times exceeding 72 hours in almost half of the IDEs may have promoted continuation of unnecessary treatment. Faster turnaround would facilitate changes to management and help avoid antibiotic overuse.12,29 On the other hand, our findings highlight the impact of inappropriate diagnosis on antibiotic prescribing. Of the total antibiotic prescriptions, 23.6% were made and maintained in patients without a confirmed diagnosis (as defined by CPGs), which not only exposes children to adverse drug effects but also contributes to the serious problem of bacterial drug resistance.36-38 However, our analysis of the management of UTI by PC pediatricians reveals a lower frequency of inappropriate treatment compared to other studies, mostly conducted in emergency care settings, which have reported rates of antibiotic overuse of 36 to 59%.12,18
In addition, we found evidence of inappropriate use of follow-up culture, especially in IDEs, but a fourth of them were ordered in ADEs, despite all CPGs discouraging this practice.2,3,5 Routine performance of UCf/u can trigger the performance of a series of additional unnecessary tests and treatments, increasing the costs and burden for the health care system.1,5,16,37,38
The main strengths of the study are its prospective design, the large number of records included in the analysis and its national scope, which provide a comprehensive perspective of diagnostic practices in pediatric UTI in Spain. Among the limitations, it should be noted that participation was voluntary and uneven across regions, which precluded the proportional and homogeneous representation of all autonomous communities in the country.
CONCLUSIONS
This study allowed the identification of the most prevalent errors in the diagnosis of pediatric UTIs in everyday clinical practice in Spain: (1) performance of urine culture with samples obtained using urine collection bags in incontinent patients; (2) omission of urine culture in patients with a positive UDT, especially those positive for LE; (3) incorrect interpretation of colony counts without taking into account the sample collection method; (4) diagnosis of UTI based on nonspecific signs and symptoms without performance of urine culture for confirmation or with performance of culture using an inadequate sample1,2,6 and (5) the lack of an individualized evaluation in atypical UTI cases.37,39
The frequency of errors in the diagnosis of suspected UTI was small, which was indicative of high-quality care delivery by participating pediatricians.16,18 Nevertheless, we believe that coordinated educational interventions targeting different care settings are still needed to correct some practices and promote adherence to CPGs1,13,15,28,38 in order to improve care quality and patient safety.20,36
CONFLICTS OF INTEREST
The authors have no conflicts of interest to declare in relation to the preparation and publication of this article.
This study received a primary care research grant from the Asociación Española de Pediatría de Atención Primaria-Fundación para la Salud (AEPap-FPS) in 2019.
Preliminary and partial data from this study were presented as an oral communication at the 19th AEPap Updates in Pediatrics Congress, held in 2023.
AUTHORSHIP
Author contributions: drafting the manuscript (JAA y MEMH), statistical analysis (RJA), study design, coordination with collaborators, literature search and final review of manuscript (all authors).
ACKNOWLEDGMENT
We thank all the pediatricians that collaborated in patient recruitment and episode documentation.
ABBREVIATIONS
ABX: antibiotherapy · ADE: appropriately diagnosed urinary tract infection episodes· CFU: colony-forming units · CPG: clinical practice guideline · hED: hospital-based emergency department · IDE: inappropriately diagnosed urinary tract infection episode · IQR: interquartile range · LE: leukocyte esterase · OR: odds ratio · PC: primary care · RF: risk factor · RM: renal malformation · rPC: routine primary care · SD: standard deviation · UCf/u: follow-up urine culture · UDT: urine dipstick test · uPC: urgent primary care · UC: urine culture · UTI: urinary tract infection · VUR: vesicoureteral reflux · 95 CI: 95% confidence interval.
REFERENCES
- Grupo de trabajo de la Guía de Práctica Clínica sobre Infección del Tracto Urinario en la Población Pediátrica. Guía de Práctica Clínica. Infección del Tracto Urinario en la Población Pediátrica. Actualización 2024 [online] [accessed 20/11/2025]. Available at https://serviciopediatria.com/wp-content/uploads/2024/05/2024_GPC-Infeccion-Tracto-Urinario-en-Pediatria.pdf
- Grupo de trabajo de la Guía de Práctica Clínica sobre Infección del Tracto Urinario en la Población. Guía de Práctica Clínica sobre Infección del Tracto Urinario en la Población Pediátrica. 2011 [online] [accessed 20/11/2025]. Available at https://portal.guiasalud.es/wp-content/uploads/2018/12/GPC_483_ITU_poblacion_pediatrica_ICS_compl.pdf
- Piñeiro Pérez R, Cilleruelo Ortega MJ, Ares Álvarez J, Baquero-Artigao F, Silva Rico JC, Velasco Zúñiga R, et al. Recomendaciones sobre el diagnóstico y tratamiento de la infección urinaria. An Pediatr (Barc). 2019;90:400.el-400.e9. https://doi.org/10.1016/j.anpedi.2019.02.009
- Olson P, Dudley AG, Rowe CK. Contemporary Management of Urinary Tract Infections in Children. Curr Treat Options Pediatr. 2022;8:192-210. https://doi.org/10.1007/s40746-022-00242-1
- SUBCOMMITTEE ON URINARY TRACT INFECTION. Reaffirmation of AAP Clinical Practice Guideline: The Diagnosis and Management of the Initial Urinary Tract Infection in Febrile Infants and Young Children 2-24 Months of Age. Pediatrics. 2016;138(6):e20163026. https://doi.org/10.1542/peds.2016-3026
- González Rodríguez J, Justa Roldán M. Protocolos diagnósticos y terapéuticos de Nefrología Pediátrica. Asociación Española de Pediatría. Infección de las vías urinarias en la infancia. p. 103-9 [online] [accessed 20/11/2025]. Available at www.aeped.es/documentos/protocolos-diagnosticos-y-terapeuticos-nefrologia-pediatrica
- Waterfield T, Foster S, Platt R, Barrett MJ, Durnin S, Maney JA, et al. Diagnostic test accuracy of dipstick urinalysis for diagnosing urinary tract infection in febrile infants attending the emergency department. Arch Dis Child. 2022;107:1095-9.
- Becknell B, Watson JR. Reexamining the Role of Pyuria in UTI Diagnosis. Pediatrics. 2024;154. https://doi.org/10.1542/peds.2024-068242
- Shaikh N, Campbell EA, Curry C, Mickles C, Cole EB, Liu H, et al. Accuracy of Screening Tests for the Diagnosis of Urinary Tract Infections in Young Children. Pediatrics. 2024;154. https://doi.org/10.1542/peds.2024-066600
- Shaikh N, Haralam MA, Kurs-Lasky M, Hoberman A. Association of Renal Scarring With Number of Febrile Urinary Tract Infections in Children. JAMA Pediatr. 2019;173:949-52. https://doi.org/10.1001/jamapediatrics.2019.2504
- Kucherov V, Russell T, Smith J, Zimmermann S, Johnston EK, Rana MS, et al. Antibiotic Overtreatment of Presumed Urinary Tract Infection Among Children with Spina Bifida. J Pediatr. 2024;272:114092.
- Hawkins S, Ericson JE, Gavigan P. Opportunities for Antibiotic Reduction in Pediatric Patients With Urinary Tract Infection After Discharge From the Emergency Department. Pediatr Emerg Care. 2023;39:184-7. https://doi.org/10.1097/PEC.0000000000002868
- Hoen LA, Bogaert G, Radmayr C, Dogan HS, Nijman RJM, Quaedackers J, et al. Update of the EAU/ESPU guidelines on urinary tract infections in children. J Pediatr Urol. 2021;17:200-7.
- Brandström P, Lindén M. How Swedish guidelines on urinary tract infections in children compare to Canadian, American and European guidelines. Acta Paediatr. 2021;110:1759-71. https://doi.org/10.1111/apa.15727
- Urinary tract infection in under 16s: diagnosis and management. Guidance. NICE [online]. NICE; 2022 [online] [accessed 20/11/2025]. Available at www.nice.org.uk/guidance/ng224
- Hadjipanayis A, Grossman Z, Torso S Del, Van Esso D, Dornbusch HJ, Mazur A, et al. Current primary care management of children aged 1–36 months with urinary tract infections in Europe: large scale survey of paediatric practice. Arch Dis Child. 2015; 100:341-7. https://doi.org/10.1136/archdischild-2014-306119
- Ostrow O, Prodanuk M, Foong Y, Singh V, Morrissey l, Harvey G, et al. Decreasing Misdiagnoses of Urinary Tract Infections in a Pediatric Emergency Department. Pediatrics. 2022;150. https://doi.org/10.1542/peds.2021-055866
- Al-Sayyed B, Le J, Al-Tabbaa MM, Barnacle B, Ren J, Tapping R, et al. Uncomplicated Urinary Tract Infection in Ambulatory Primary Care Pediatrics: Are We Using Antibiotics Appropriately? J Pediatr Pharmacol Ther. 2019;24:39-44. https://doi.org/10.5863/1551-6776-24.1.39
- Sanpera Iglesias J, Garcia Nicoletti M. G231(P) Improving the diagnosis and management of urinary tract infections in under 3S in a busy district hospital. Arch Dis Child. 2019;A94.1-A94. https://doi.org/10.1136/archdischild-2019-rcpch.225
- Shehu E, Kugler CM, Schäfer N, Rosen D, Schaefer C, Kötter T, et al. Barriers and facilitators of adherence to clinical practice guidelines in Germany—A systematic review. J Eval Clin Pract. 2025;31:e14173. https://doi.org/10.1111/jep.14173
- Nelson Z, Tarik Aslan A, Beahm NP, Blyth M, Cappiello M, Casaus D, et al. Guidelines for the Prevention, Diagnosis, and Management of Urinary Tract Infections in Pediatrics and Adults: A WikiGuidelines Group Consensus Statement. JAMA Netw Open. 2024;7(11):e2444495. https://doi.org/10.1001/jamanetworkopen.2024.44495
- Ochoa Sangrador C, Pascual Terrazas A. Revisión sistemática de la validez de los urocultivos recogidos con bolsa estéril perineal. An Pediatr. 2016;84:97-105. https://doi.org/10.1016/j.anpedi.2015.04.003
- Cenzato F, Milani GP, Amigoni A, Sperotto F, Bianchetti MG, Agostoni C, et al. Diagnosis and management of urinary tract infections in children aged 2 months to 3 years in the Italian emergency units: the ItaUTI study. Eur J Pediatr. 2022;181:2663-71. https://doi.org/10.1007/s00431-022-04457-0
- Buettcher M, Trueck J, Niederer-Loher A, Heininger U, Agyeman P, Asner S, et al. Swiss consensus recommendations on urinary tract infections in children. Eur J Pediatr. 2021;180:663-74. https://doi.org/10.1007/s00431-020-03714-4
- Herreros ML, Barrios A, Sánchez A, del Valle R, Pacheco M, Gili P. Urine collection methods in precontinent children treated at the paediatric emergency department. Acta Paediatr. 2023;112:550-6. https://doi.org/10.1111/apa.16614
- Schroeder AR, Chang PW, Shen MW, Biondi EA, Greenhow TL. Diagnostic Accuracy of the Urinalysis for Urinary Tract Infection in Infants <3 Months of Age. Pediatrics. 2015;135:965-71. https://doi.org/10.1542/peds.2015-0012
- Ares Álvarez J, García Vera C, González Rodríguez JD. Infección del tracto urinario (ITU). En: Guía ABE. 2024 [online] [accessed 20/11/2025]. Available at guia-abe.es/temas-clinicos-infeccion-del-tracto-urinario-(itu)
- Khoury l, Schnapp Z, Konopnicki M. Improving Management Novel Guidelines for Diagnosing Urinary Tract Infection in Infants. Pediatr Infect Dis J. 2024;43:609-13. https://doi.org/10.1097/INF.0000000000004292
- Watson JR, Sánchez PJ, Spencer JD, Cohen DM, Hains DS. Urinary Tract Infection and Antimicrobial Stewardship in the Emergency Department. Pediatr Emerg Care. 2018;34:93-5. https://doi.org/10.1097/PEC.0000000000000688
- Kuster N, Robino l. Interpretación de los tests de sospecha e inicio de la terapia antibiótica empírica en infecciones urinarias. Arch Pediatr Urug. 2020;91:21-8. https://doi.org/10.31134/ap.91.1.4
- Romano ME. Prepubertal Vulvovaginitis. Clin Obstet Gynecol. 2020;63:479-85. https://doi.org/10.1097/GRF.0000000000000536
- Boon HA, Van den Bruel A, Struyf T, Gillemot A, Bullens DMA, Verbakel JY. Clinical features for the diagnosis of pediatric urinary tract infections: Systematic review and meta-analysis. Ann Fam Med. 2021;19:437-46. https://doi.org/10.1370/afm.2684
- Tullus K, Shaikh N. Urinary tract infections in children. 2020;395:1659-68. https://doi.org/10.1016/S0140-6736(20)30676-0
- Biyikli NK, Alpay H, Guran T. Hypercalciuria and recurrent urinary tract infections: incidence and symptoms in children over 5 years of age. Pediatric Nephrology 2005 20:10. 2005;20:1435-8. https://doi.org/10.1007/s00467-005-1892-y
- García-Nieto V, Moraleda-Mesa T, Tejera-Carreño P. Hipercalciuria e hipocitraturia. El concepto de prelitiasis en Pediatría. Pediatr Integral. 2022;XXVI:492-500.
- Saposnik G, Redelmeier D, Ruff CC, Tobler PN. Cognitive biases associated with medical decisions: a systematic review. BMC Medical Informatics and Decision Making 2016 16. 2016; 16:1-14. https://doi.org/10.1186/s12911-016-0377-1
- Bryant PA, Bitsori M, Vardaki K, Vaezipour N, Khan M, Buettcher M. Guidelines for Complicated Urinary Tract Infections in Children: A Review by the European Society for Pediatric Infectious Diseases. Pediatr Infect Dis J. 2025;44:e211. https://doi.org/10.1097/INF.0000000000004790
- Mattoo TK, Shaikh N, Nelson CP. Contemporary management of urinary tract infection in children. Pediatrics. 2021;147. https://doi.org/10.1542/peds.2020-012138
- Albañil Ballesteros MR, Cubero Santos A, Martínez Chamorro MJ, Muñoz Hiraldo ME, Ares Álvarez J, Morillo Gutiérrez B, et al. Etiología y resistencia a los antibióticos en la infección urinaria pediátrica. Estudio multicéntrico desde Atención Primaria. Rev Pediatr Aten Primaria. 2024;26:361-72. https://doi.org/10.60147/5d2a9a33