
Vol. 26 - Num. 102
Original Papers
Vitamin D levels in an area of low solar radiation in the north of the Iberian Peninsula
Ferran Campillo i Lópeza, Laia Ferré Moraguesa, Diego Alberto Rincón Díaza, Emiliano Heras Martína, María Marlene Rojas de Millsa, Ernesto Segarra Garcíaa, Anton Foguet i Vidal a
aEquipo pediátrico territorial de la Garrotxa. Fundación Hospital de Olot y Comarcal de la Garrotxa. Olot. Gerona. España.
Correspondence: F Campillo i López. E-mail: fcampillo@hospiolot.cat
Reference of this article: Campillo i López F, Ferré Moragues L, Rincón Díaz DA, Heras Martín E, Rojas de Mills MM, Segarra García E, et al. Vitamin D levels in an area of low solar radiation in the north of the Iberian Peninsula . Rev Pediatr Aten Primaria. 2024;26:137-45. https://doi.org/10.60147/2e098110
Published in Internet: 20-05-2024 - Visits: 19217
Abstract
Introduction: vitamin D deficiency is a cause of concern in Europe, especially in latitudes above the 40° N parallel, and several clinical factors are involved. Most prevalence studies in the paediatric population in Spain have been carried out in latitudes with high sunlight exposure.
Materials and Methods: cross-sectional descriptive study in two periods (summer and winter seasons) in healthy children aged 2 to 14 years between July 15, 2013 and April 15, 2016, through data collection and blood analysis (calcifediol, calcium, phosphorus) in a total of 603 children residing in La Garrotxa (Girona) (latitude 42° N), an area in Catalonia with low sun exposure. We calculated prevalences and performed a multivariable regression analysis to determine the impact of different clinical variables.
Results: 31.86% of children had levels of vitamin D below 20 ng/mL that increased to 52.87% in winter. Ethnicity, phototype and season of the year accounted for 53.2% of the observed variation.
Conclusions: children in an area of low solar radiation of Spain had a high prevalence of hypovitaminosis D, especially in the winter, in those with dark skin phototypes and in certain ethnic groups.
Keywords
● Ethnicity ● Skin pigmentation ● Solar radiation ● Vitamin D ● Vitamin D deficiencyINTRODUCTION
Vitamin D deficiency has been a growing concern in recent years. Although different criteria are applied by different countries or scientific societies, a global consensus has been established that values greater than 20 ng/mL (50 nmol/L) is indicative of sufficiency, values of 12-20 ng/mL of insufficiency and values of less than 12 ng/mL of deficiency.1 In Europe, 40.4% of the population is believed to have insufficient vitamin D levels, a percentage that increases during winter.2 In addition to rickets and musculoskeletal disorders associated with calcium and phosphorus metabolism, vitamin D deficiency has been associated with several cardiovascular, autoimmune, infectious and neurologic diseases.3 Limited sunlight exposure, especially in regions at latitudes in either extreme (more than 40° N or S), skin phototype (the more melanin, the less vitamin D produced) and cultural aspects can contribute to low vitamin D levels.4
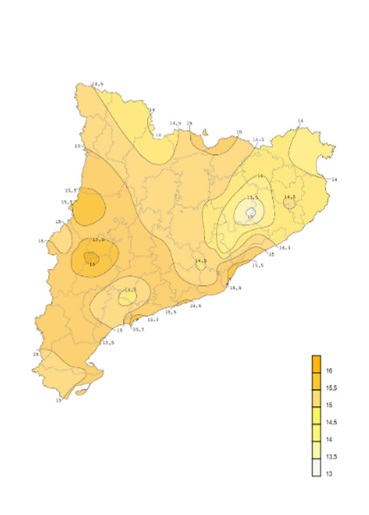
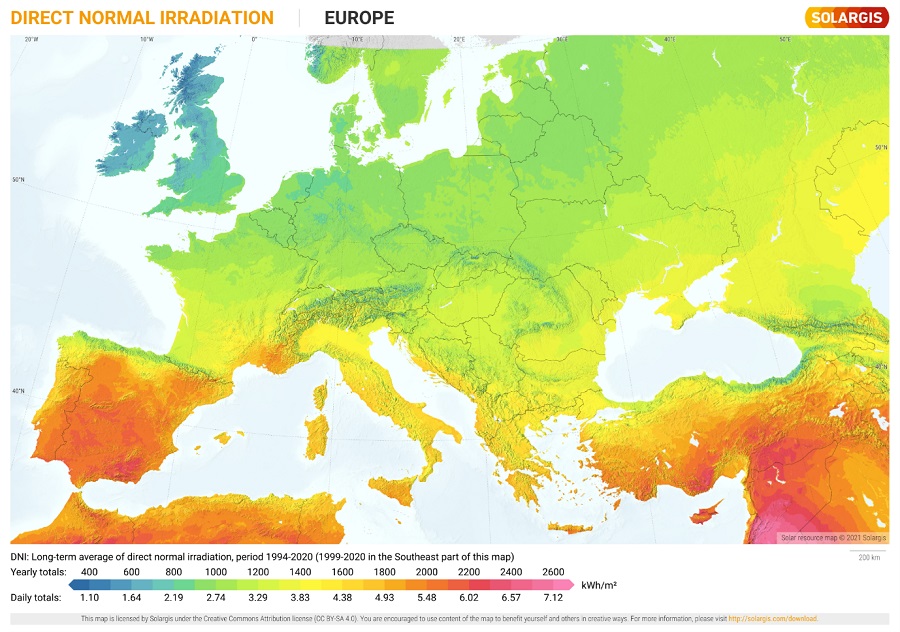
Catalonia is located above the 40th parallel N and its northernmost comarcas (administrative districts) are 42° N. The Pre-Pyrenees and the Catalan Pyrinees, in addition to most of the comarcas in Gerona and the mountainous areas of Camp de Tarragona and the Terres de l'Ebre are the territories in Catalonia with the least solar radiation exposure (Figure 1),5 similar to the Spanish regions of Navarre or La Rioja or some provinces in the regions of Aragon, Castilla y Leon or Galicia, as well as other areas in Europe, like the north of Portugal, the south of France, the centre of Italy Greece or the Balkans (Figure 2).
| Figure 1. Daily total irradiation map of Catalonia, annual mean (MJ/m2) |
|---|
 |

| Figure 2. Direct normal irradiation map of Europe, annual mean (kWh/m2) |
|---|
 |

Most studies on the prevalence of hypovitaminosis D in Spain have been conducted in areas further south with greater solar radiation exposure.6 The aim of our study was to assess vitamin D status in a paediatric population with a lower level of sunlight exposure as well as potential clinical predictors.
MATERIAL AND METHODS
We conducted a cross-sectional descriptive study in healthy children over 2 separate seasonal periods (summer and winter) between July 15, 2013 and April 15, 2016. The geographical area from which the sample was selected was the comarca of Garrotxa, located at latitude 40° N in the Pre-Pyrenees region of the Gerona province. The four basic health zones of the comarca and the regional hospital corresponding to the local paediatric care catchment area participated in the study, in which blood samples were analysed by chemiluminescent microparticle immunoassay for quantitative measurement of 25-hydroxy vitamin D in human serum and plasma samples.
The sample included healthy boys and girls residing in la Garrotxa aged 2 to 14 years who did not meet any of the following exclusion criteria: moderate or severe asthma (children with occasional episodes of asthma were not excluded), renal or hepatic failure, gastrointestinal disorders that cause malabsorption, cystic fibrosis, endocrine or metabolic disorders, skin disorders requiring prolonged treatment with corticosteroids, immunosuppression (due to disease or treatment), vegan diet, ongoing treatment with vitamin D3 or obesity (body mass index [BMI] > 97th percentile).
After obtaining informed consent, we recorded the age, sex, phototype (Fitzpatrick scale) weight, height and BMI of the patients, data which were anonymised. We also conducted blood chemistry tests to measure the levels of calcium, phosphorus and calcifediol or 25-hydroxi vitamin D, which was the primary outcome under study.
We expressed the descriptive data as absolute frequencies and percentages for categorical variables and as minimum, maximum, mean and standard deviation for quantitative variables. We assessed the normality of quantitative variable distributions with the Shapiro-Wilk test. To compare quantitative variables in different groups, we used ANOVA or the nonparametric Kruskal-Wallis test, depending on whether the data were normally distributed. To compare categorical variables, we used the Pearson chi-square test or the Fisher exact test as applicable. We calculated correlation coefficients for the association between vitamin D and other variables. To assess the contribution of the clinical variables to the variance in vitamin D levels, we conducted a multiple regression analysis using one-hot encoding to generate a new binary variable for each category. We defined statistical significance as p <0.05.
We entered the data for the study variables in a Microsoft Access® database and then exported them to the open-access software PSPP version 1.2.0-g0fb4db to carry out the statistical analysis. At the same time, we used Julius.ai, an artificial intelligence tool based on the OpenAI GPT-3 framework for data handling, statistical analysis and data interpretation.
The study protocl was evaluated and approved by the Clinical Research Ethics Committee of the Hospital Universitario de Girona Josep Trueta (AC 89-13).
RESULTS
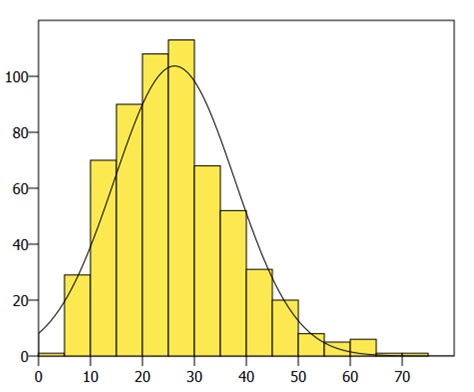
We recruited a total of 603 children whose characteristics are described in Tables 1 and 2. The levels of vitamin D followed a normal distribution (Figure 3). We found values greater than 20 ng/mL (sufficiency) in 68.33%, of 12toy 20 ng/mL (insufficiency) in 22.38% and o less than 12 ng/mL (deficiency) in 9.29%. There were no statistically significant differences in the characteristics of the sample between the two study periods, except in the mean vitamin D values in summer (29.40 ng/mL) versus winter (19.05 ng/mL). In summer, the prevalences of sufficiency, insufficiency and deficiency were 82.73%, 15.59% and 1.67%, respectively, while in winter they were 47.13%, 31.97% and 20.90%. The mean vitamin D level varied in association with the skin phototype (Table 3), with a statistically significant difference between children with light skin tones (phototypes 1-3: 30.24 ng/mL) and dark skin tones (phototypes 4-6: 19.74 ng/mL) (p 0.008), and also in association with ethnicity (Table 4). The coefficients for the correlations between the different variables and the vitamin D level can be found in Table 5. The multivariate regression analysis that included independent clinical variables (age, sex, weight, height, BMI, ethnicity, phototype, season) yielded a coefficient of determination (R2) of 0.532, suggesting that 53.2% of the variance could be explained by these clinical variables. Of all these variables, only the phototype, the ethnicity and the season were statistically significant predictors. The correlation coefficient for the association between phototype and ethnicity was high (0.876225), so, to rule out multicollinearity, we fitted another two models, including only one of these variables in each of them. The R2 was 0.529 for the model that included ethnicity and 0.448 for the model that included the phototype.
| Table 1. Frequency distributions of the sample | |||
|---|---|---|---|
| n | % | ||
| Sex | Female | 281 | 46.6 |
| Male | 322 | 53.4 | |
| Season | Summer | 359 | 59.5 |
| Winter | 244 | 40.5 | |
| Ethnicity | White/European | 306 | 50.7 |
| White/Latin American | 42 | 7.0 | |
| Maghrebi/Arabian | 63 | 10.4 | |
| Asian/Indian | 73 | 12.1 | |
| Southeast Asian/China | 14 | 2.3 | |
| Romani | 2 | 0.3 | |
| Black/African | 103 | 17.1 | |
| Phototype | 1 | 13 | 2.2 |
| 2 | 130 | 21.6 | |
| 3 | 228 | 37.8 | |
| 4 | 98 | 16.3 | |
| 5 | 33 | 5.5 | |
| 6 | 101 | 16.7 | |

| Table 2. Descriptive analysis, range and means | ||||
|---|---|---|---|---|
| Minimum | Maximum | Mean | Standard deviation | |
| Age (years) | 2 | 14 | 7.95 | 3.48 |
| Weight (kg) | 9.1 | 80 | 28.74 | 13.21 |
| Height (cm) | 82 | 182 | 126.85 | 22.41 |
| BMI | 12.08 | 28 | 16.78 | 2.54 |
| Calcium (mg/dL) | 8.4 | 12.3 | 9.76 | 0.38 |
| Phosphorus (mg/dL) | 3.1 | 7.0 | 5.04 | 0.55 |
| Vitamin D (ng/mL) | 3.5 | 70.8 | 26.19 | 11.59 |

| Figure 3. Histogram showing the distribution (n) of vitamin D levels (ng/mL) |
|---|
 |

| Table 3. Vitamin D levels by phototype | |||
|---|---|---|---|
| Phototype | Mean (ng/mL) | n | Standard deviation |
| 1 | 30.43 | 13 | 10.99 |
| 2 | 30.54 | 130 | 10.51 |
| 3 | 30.06 | 228 | 11.20 |
| 4 | 22.96 | 98 | 11.68 |
| 5 | 20.25 | 33 | 5.84 |
| 6 | 16.44 | 101 | 6.75 |

| Table 4. Vitamin D levels by ethnic group | |||
|---|---|---|---|
| Ethnicity | Mean (ng/mL) |
n | Standard deviation |
| White/European | 32.68 | 306 | 10.93 |
| White/Latin American | 26.01 | 42 | 6.65 |
| Maghrebi/Arabian | 20.45 | 63 | 6.83 |
| Asian/Indian | 17.98 | 73 | 8.40 |
| Southeast Asian/China | 25.20 | 14 | 6.90 |
| Romani | 25.40 | 2 | 0.42 |
| Black/African | 16.50 | 103 | 6.64 |

| Table 5. Correlation coefficients for the association with vitamin D | ||
|---|---|---|
| Correlation | p value | |
| Age | 0.105402 | 0.00989987* |
| Ethnicity | -0.545708 | <0.0001* |
| Phototype | -0.37943 | <0.0001* |
| Weight | 0.0652751 | 0.110802 |
| Height | 0.085449 | 0.0367056* |
| BMI | 0.00530901 | 0.896918 |
| Calcium | 0.131348 | 0.00128538* |
| Phosphorus | -0.103725 | 0.0111477* |
|
*p <0.05 |
||

DISCUSSION
Overall, 31.86% of previously healthy children and adolescents in Garrotxa had insufficient vitamin D levels (<20 ng/mL). A multicentre study conducted in Spain that included children aged 8 to 13 years residing in different latitudes (A Coruña, Barcelona, Madrid, Seville and Valencia) found a global prevalence of 35%.7
The season of the year was associated with significant differences in the prevalence of hypovitaminosis, which increased in winter, when 52.87% of the sample had levels below 20 ng/mL, and decreased to 17.27% in the summer. In Navarre (42° N), in a study with a sample size and latitude that were similar, hypovitaminosis was also found in 62.6% of the sample in winter and 20.0% in summer 8; in Asturias (42-43° N), a little further north, a prevalence of 71.8% was found in winter compared to 34.5% in summer.9 In contrast, studies conducted further south (in smaller samples) found lower prevalences: in Madrid (40° N), 51% had values below 20 ng/mL in winter10; in Zaragoza (41° N), 29.2%, in winter and 25% in summer11; in Cadiz (36° N) the prevalence of hypovitaminosis in winter was 45.2%12, and in Cordoba (37° N) hypovitaminosis was not detected in winter.13 This association of hypovitaminosis D with the season of the year and also in relation to latitude has also been observed in European cohorts, with a lower prevalence in the Mediterranean Basin.14-16
The concentration of vitamin D was positively correlated to age. This was consistent with the findings of studies conducted in areas with greater sunlight exposure: healthy newborns in Majorca (60.8% with insufficient levels)17, preterm infants in Tarragona (50.0% with insufficient levels),18 healthy infants aged 1 to 6 months (8.4% with levels below 10 ng/mL)19 or hospitalised children under 2 years (24.3% with insufficient levels)20 in Valencia. There also seems to be a correlation between maternal vitamin D levels and umbilical cord blood levels.21
As regards the BMI, it must be taken into account that the sample excluded children with obesity. This may have limited the ability to detect the negative correlation reported by other authors.12
In la Garrotxa, the proportion of the population who is not of Spanish origin has increased in recent years (3.48% in 2000 compared to 13.38% in 2016), a phenomenon that has been observed in similar proportion in the rest of Catalonia (13.60%).22 A study conducted in Salt (Girona), where there is a greater percentage of children from immigrant families compared to the average in Catalonia (72% nonwhite participants)23 found statistically significant differences in vitamin D levels between ethnic groups.
The mathematical model based on clinical data was able to predict 53.2% of the variation in vitamin D levels, and the phototype, ethnicity and season of the year were the most important predictors. Despite the expected overlap between ethnicity and phototype, each of these variables covered different aspects. In fact, ethnicity explained more of the variance. This finding could be explained by cultural or religious factors, such as the time spent indoors, clothing covering a greater percentage of the body surface area20 or dietary habits.
Still, the remaining variance could be due to other factors that were not included in the model. Previous meta-analyses have found that individuals exposed to tobacco smoke had significantly lower vitamin D levels compared to those not exposed. 24 It is estimated that the source of 80% to 90% of vitamin D is sunlight exposure, but the rest could be due to dietary intake, chiefly consumption of fish, mushrooms and, to a lesser extent, some enriched dairy products.25 The percentage of time that children spent out of doors is also key for achieving these hours of sunlight exposure.15 Children and adolescents who live in neighbourhoods with more green spaces have higher levels of vitamin D.26 Climate change is also a concern in regard to the deleterious effects of exposure to more intense sunlight radiation, and it can promote changes in habits toward spending more time indoors or using sunscreen.27
Whether supplementation with exogenous vitamin D is necessary beyond infancy is still under debate.28 Supplementation in the first year of life appears to contribute to optimal levels later on.11 The identification of clinical factors that can serve as predictors for the potential development of vitamin D deficiency may be useful for establishing strategies to address these deficits. Activities that take place outdoors and in contact with nature, with an environmental and sociocultural tenor, especially in winter, in addition to interventions seeking to eliminate exposure to second-hand smoke in the home, could be key in the approach to the treatment and prevention of hypovitaminosis D in northern latitudes.
CONCLUSION
The prevalence of hypovitaminosis D in this area with lower solar radiation exposure was higher compared to studies conducted further south in the Iberian peninsula. Ethnicity, skin phototype and season of the year were relevant clinical variables for the purpose of developing strategies to improve vitamin D levels.
CONFLICTS OF INTEREST
The authors have no conflicts of interest to declare in relation to the preparation and publication of this article. This work did not receive any form of funding.
AUTHORSHIP
Author contributions: bibliographic search, data analysis, manuscript draft and final revision (FLC), bibliographic search, manuscript draft and final revision (LFM), study conception and design, data collection, final revision (DARD), data collection and final revision (EHM, MMRM and ESG), study conception and design, final revision (AFV).
ABBREVIATIONS
· BMI: body mass index · N: north · S: south.
REFERENCES
- Munns CF, Shaw N, Kiely M, Specker BL, Thacher TD, Ozono K, et al. Global Consensus Recommendations on Prevention and Management of Nutritional Rickets. J Clin Endocrinol Metab. 2016;101:394-415. https://doi.org/10.1210/jc.2015-2175
- Cashman KD, Dowling KG, Škrabáková Z, González Gross M, Valtueña J, Henauw SD, et al. Vitamin D deficiency in Europe: pandemic? Am J Clin Nutr. 2016;103:1033-44. https://doi.org/10.3945/ajcn.115.120873
- Holick MF. The vitamin D deficiency pandemic: Approaches for diagnosis, treatment and prevention. Rev Endocr Metab Disord. 2017;18:153-65. https://doi.org/10.1007/s11154-017-9424-1
- Misra M, Pacaud D, Petryk A, Ferrez Collett-Solberg P, Kappy M. Deficiencia de vitamina D en los niños y su tratamiento: revisión del conocimiento y las recomendaciones actuales. 2008;66:86-106. https://doi.org/10.1542/peds.2007-1894
- Sancho Ávila JM, Riesco Martín J, Jiménez Alonso C, Sánchez de Cos Escuin MC, Montero Cadalso J, López Bartolomé M. Atlas de Radiación Solar en España utilizando datos del SAF de Clima de EUMETSAT. 2012 [online] [accessed 09/05/2024]. Available at https://www.aemet.es/documentos/es/serviciosclimaticos/datosclimatologicos/atlas_radiacion_solar/atlas_de_radiacion_24042012.pdf
- Domenech Vallejo A. Situación de los niveles de vitamina D en la edad pediátrica y adolescencia en España. Universitat de les Illes Balears; 2022 [online] [accessed 09/05/2024]. Available at https://dspace.uib.es/xmlui/handle/11201/160112
- De Piero Belmonte A, Rodríguez Rodríguez E, González Rodríguez LG, Ortega Anta RM, López Sobaler AM. Vitamina D sérica y factores de riesgo metabólico en un grupo de escolares españoles. Nutr Hosp. 2015;31:1154-62. https://dx.doi.org/10.3305/nh.2015.31.3.8447
- Durá Travé T, Gallinas Victoriano F, Chueca Guindulain MJ, Berrade Zubiri S, Moreno Gónzalez P, Malumbres Chacón M. Prevalencia de hipovitaminosis D y factores asociados en la edad infantojuvenil. Aten Primaria. 2018;50:422-9. https://doi.org/10.1016/j.aprim.2017.06.003
- Rodríguez Dehli AC, Riaño Galán I, Fernández Somoano A, Navarrete Muñoz EM, Espada M, Vioque J, et al. Hipovitaminosis D y factores asociados a los 4 años en el norte de España. An Pediatr (Barc). 2017;86:188-96. https://doi.org/10.1016/j.anpedi.2016.02.003
- RodríguezRodríguez E, Aparicio A, López-Sobaler AM, Ortega RM. Vitamin D status in a group of Spanish schoolchildren. Minerva Pediatr. 2011;63:11-8.
- Martínez Redondo I, García Romero R, Calmarza P, De Arriba Muñoz A, Rodríguez Martínez G, Labarta Aizpún JI, et al. Deficiencia de vitamina D en niños aragoneses sanos. Nutr Hosp. 2018;35:782-8.
- Ruiz Ocaña P, Carrasco Fernández C, Zopeque García N, Sáez Benito A, Novalbos Ruiz JP, Lechuga Sancho AM. Niveles de vitamina D al final de la estación invernal en una población escolar sana. Rev Esp Endocrinol Pediátrica. 2014;5:19-27.
- Ramírez Prada D, De la Torre MJ, Llorente Cantarero FJ, Pérez-Navero JL, Gil Campos M. Evaluación de la exposición solar, ingesta y actividad física en relación con el estado sérico de vitamina D en niñas prepúberes españolas. Nutr Hosp. 2012;27:1993-8. https://dx.doi.org/10.3305/nh.2012.27.6.6065
- Valtueña J, González Gross M, Huybrechts I, Breidenassel C, Ferrari M, Mouratidou T, et al. Factors Associated with Vitamin D Deficiency in European Adolescents: The HELENA Study. J Nutr Sci Vitaminol (Tokyo). 2013;59:161-71. https://doi.org/10.3177/jnsv.59.161
- Sochorová l, Hanzlíková l, Černá M, Vosátková M, Grafnetterová AP, Fialová A, et al. Assessment of vitamin D status in Czech children. Cent Eur J Public Health. 2018;26:260-4. https://doi.org/10.21101/cejph.a5386
- Grossman Z, Hadjipanayis A, Stiris T, Del Torso S, Mercier JC, Valiulis A, et al. Vitamin D in European children—statement from the European Academy of Paediatrics (EAP). Eur J Pediatr. 2017;176:829-31. https://doi.org/10.1007/s00431-017-2903-2
- De Sotto Esteban D, Ursina Bëinbrech B, Ferrés Ramis l, Torbado Oliver P, Yánez Juan AM. Niveles de vitamina D y factores de riesgo asociados en recién nacidos sanos de Mallorca. Rev Esp Endocrinol Pediátrica. 2015;6:51-9.
- Ariño J, García A, Parada Ricart E, Albújar M. Relació entre les aportacions enterals de vitamina D i els nivells plasmàtics en nadons prematurs. Pediatr Catalana. 2019;79:127-32.
- Cabezuelo Huerta G, Vidal Micó S, Abeledo Gómez A, Frontera Izquierdo P. Niveles de 25-hidroxivitamina D en lactantes. Relación con la lactancia materna. An Pediatr (Barc). 2007;66:491-5. https://doi.org/10.1157/13102514
- Togo A, Espadas Maciá D, Blanes Segura S, Sivó Díaz N, Villalba Martínez C. ¿Existe déficit de vitamina D en los niños de una ciudad soleada del Mediterráneo? An Pediatr (Barc). 2016;84:163-9. https://doi.org/10.1016/j.anpedi.2015.05.003
- Blarduni E, Arrospide A, Galar M, Castaño l, Mar J. Factores asociados a la prevalencia de hipovitaminosis D en mujeres embarazadas y sus recién nacidos. An Pediatr (Barc). 2019;91:96-104. https://doi.org/10.1016/j.anpedi.2018.11.012
- Població estrangera a 1 de gener. Per comarques i Aran. Catalunya. In: Idescat [online] [accessed 09/05/2024]. Available at idescat.cat/poblacioestrangera/?geo=cat&nac=a&b=4
- Sánchez Muro JM, Yeste Fernández D, Marín Muñoz A, Fernández Cancio M, Audí Parera l, Carrascosa Lezcano A. Niveles plasmáticos de vitamina D en población autóctona y en poblaciones inmigrantes de diferentes etnias menores de 6 años de edad. An Pediatr (Barc). 2015;82:316-24. https://doi.org/10.1016/j.anpedi.2014.05.007
- Yang l, Zhao H, Liu K, Wang Y, Liu Q, Sun T, et al. Smoking behavior and circulating vitamin D levels in adults: A meta-analysis. Food Sci Nutr. 2021;9:5820-32. https://doi.org/10.1002/fsn3.2488
- Masvidal Aliberch RM, Ortigosa Gómez S, Baraza Mendoza MC, Garcia Algar O. Vitamina D: fisiopatología y aplicabilidad clínica en pediatría. An Pediatr (Barc). 2012;77:279.e1-279.e10. https://doi.org/10.1016/j.anpedi.2012.05.019
- Thiering E, Markevych I, Kress S, Astell-Burt T, Feng X, Altug H, et al. Gene-environment interaction in the association of residential greenness and 25(OH) vitamin D. Environ Pollut Barking Essex 1987. 2023;327:121519. https://doi.org/10.1016/j.envpol.2023.121519
- Norval M, Lucas RM, Cullen AP, De Gruijl FR, Longstreth J, Takizawa Y, et al. The human health effects of ozone depletion and interactions with climate change. Photochem Photobiol Sci 2011;10:199-225. https://doi.org/10.1039/c0pp90044c
- Pallás Alonso CR. ¿Hay que hacer profilaxis con vitamina D? Rev Pediatría Aten Primaria. 2014;16:75-81. https://doi.org/10.4321/S1139-76322014000200011
- Baldasano JM, Soriano C, Flores H, Esteve J. Atlas de radiació solar a Catalunya. Universitat Politècnica de Catalunya (UPC) i Institut Català d’Energia (ICAEN); 2000. Report No.: 12. [online] [accessed 09/05/2024]. Available at https://icaen.gencat.cat/ca/detalls/publicacio/Atlas-de-radiacio-solar-a-Catalunya-00003
- Solar resource maps of Europe. In: Solargis [online] [accessed 09/05/2024]. Available at https://solargis.com/maps-and-gis-data/download/europe