
Vol. 24 - Num. 96
Original Papers
Importance and performance of the habits involved in the development of excess weight according to gender
Pedro Juan Carpena Lucasa, M.ª Isabel Jiménez Candela, Francisco Sánchez Cubob, Guillermo Ceballos Santamaríab, Manuel Vargas Vargasb, José Mondéjar Jiménezb
aServicio de Pediatría. Hospital Virgen del Castillo. Yecla. Murcia. España.
bFacultad de Ciencias Sociales. Universidad de Castilla-La Mancha. Cuenca. España.
Correspondence: PJ Carpena. E-mail: pjcarpena@hotmail.com
Reference of this article: Carpena Lucas PJ, Jiménez Candel MI, Sánchez Cubo F, Ceballos Santamaría G, Vargas Vargas M, Mondéjar Jiménez J. Importance and performance of the habits involved in the development of excess weight according to gender . Rev Pediatr Aten Primaria. 2022;24:363-74.
Published in Internet: 14-12-2022 - Visits: 12807
Abstract
Introduction: obesity affects more adolescents every day. The key to prevention remains the control of modifiable risk factors. The objective of the work was to carry out an analysis using importance-performance maps of the main behaviors that condition the appearance of excess weight in adolescents according to gender. A statistical technique that draws on a map the importance and performance of each of the risk factors involved in the development of excess weight.
Material and methods: we collected information from 416 adolescents between 12 and 14 years of age in Murcia (Spain) using the ENHASA healthy habits questionnaire. Later, we determined the somatometry and they were classified following the criteria of the World Health Organization (WHO). A multivariate analysis and importance-performance maps according to gender were performed.
Results: 416 adolescents participated. We obtained 40,6% excess weight without significant differences by sex. The analysis showed an R2 of 0,123 in boys and 0,156 in girls. Lack of physical activity revealed as the most important factor for the development of excess weight in boys, although the habits with the greatest capacity for improvement were those related to the use of television and screen time. In girls, the most determining dimension was the socio-school environment; and the habits with the lowest performance were also those related to the use of screens.
Conclusions: there are gender differences in the habits that determine overweight and obesity. It is important to take a gender perspective into account when designing new more efficient prevention.
Keywords
● Adolescent ● Gender role ● Life habits ● Obesity ● Overweight ● Prevention and controlINTRODUCTION
Childhood obesity is an important public health problem in developed countries, but also in developing countries.1 At present, approximately 4 out of 10 children worldwide have excess weight.2,3 It is a complex disease with a multifactorial aetiology for which there is currently no curative treatment and that entails the development of multiple comorbidities such as coronary disease, type 2 diabetes, hypertension, dyslipidaemia, pulmonary disorders, depression and some forms of cancer.4,5 According to the Organisation for Economic Co-operation and Development (OECD), the direct costs of obesity already amount to 9.7% of the total national health spending.6 Given that more than 50% of obese children will continue to be obese in adulthood,7 preventive interventions aimed at changing lifestyle habits in childhood should be the cornerstone of the strategy against obesity.8
As early as 1997, given the seriousness of the problem, the World Health Organization (WHO) declared obesity a global epidemic and proposed a series of preventive measures. Since then, multiple interventions have been implemented at every level,9-11 but, while they have achieved positive results, they have still proven insufficient, as obesity continues to increase in Spain.9,12
On the other hand, adolescence is a key stage during which physiological, psychological and social changes take place that will have an impact on the development of specific habits that may contribute to the development of overweight and obesity.13,14 Just as the patterns of pubertal development or body fat distribution vary based on sex, there are also differences in physiology and patterns of personal development between male and female adolescents. Previous studies have made descriptive analyses of lifestyle in adolescents based on sex with heterogeneous results, but most of them concur that in male adolescents, outcomes are better in variables determined by physical activity and sports. 15-19 The disagreement is greater when it comes to diet, as most studies conclude that sex is not associated with the type or quality of the diet,19,20 but others have reported better dietary patterns in female adolescents.21 As regards technology, there do not seem to be significant differences in the total screen time, but there are differences in the type of use: male adolescents spend more time on the internet and playing videogames, while female adolescents spend more time on mobile phones and social networks.22–24 Lastly, sociability also seems to be associated with sex, as female adolescents exhibit more engagement in school and better academic performance, although also lower levels of self-esteem, psychological wellbeing and body image satisfaction.14,22,25
Based on the above, it is fair to conclude that there are various factors related to the habits and behaviours of young individuals that may be determined by sex. Thus, the aim of our study was to include this perspective to explore the main behaviours associated with the development of excess weight in adolescents in relation to sex in the region of Murcia, Spain, using importance-performance map analysis. Through this approach, the identification of the most important habits—determinants with the most potential to be modified—could be an appropriate strategy for the purpose of developing more efficient control programmes.
MATERIAL AND METHODS
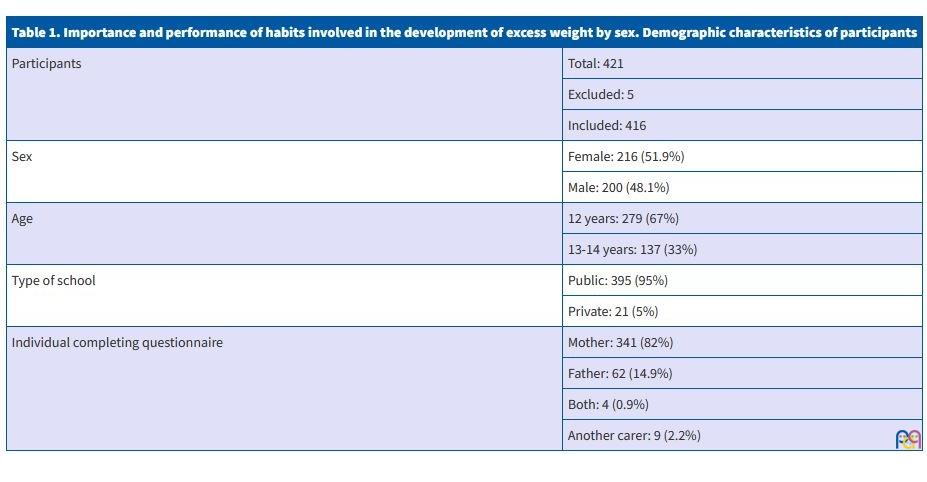
We conducted a cross-sectional study in Health Area V of the Region of Murcia (Spain) during the 2017-18 and 2018-19 academic years. The study population consisted of students enrolled in the first year of compulsory secondary education (ESO, or Educación Secundaria Obligatoria) aged 12 to 14 years. The exclusion criteria were the presence of any severe chronic or endocrine disease, eating disorders that could interfere with weight and height gain in the student and/or refusal of the parents or the student to participate in the study. Table 1 presents the main demographic characteristics of the sample. Taking as reference the census data of the Instituto Nacional de Estadística (INE), after identifying the number of adolescents in the age range of interest residing in the municipalities comprehended in Health Area V, we calculated we would need a minimum sample of 350 students for a maximum error of 4.92% and a 95% level of confidence. To obtain such a sample, we invited the 7 secondary education schools of the area to participate, of which 3 refused claiming difficulties in integrating the study in the school schedule. Of the remaining schools, 3 public and 1 private, we included 100% of the students that accepted to participate. The study was approved by the Clinical Research Ethics Committee of the Hospital Universitario Virgen de la Arrixaca de Murcia (Spain).
| Table 1. Importance and performance of habits involved in the development of excess weight by sex. Demographic characteristics of participants | |
|---|---|
| Participants | Total: 421 |
| Excluded: 5 | |
| Included: 416 | |
| Sex | Female: 216 (51.9%) |
| Male: 200 (48.1%) | |
| Age | 12 years: 279 (67%) |
| 13-14 years: 137 (33%) | |
| Type of school | Public: 395 (95%) |
| Private: 21 (5%) | |
| Individual completing questionnaire | Mother: 341 (82%) |
| Father: 62 (14.9%) | |
| Both: 4 (0.9%) | |
| Another carer: 9 (2.2%) | |
The data collection was carried out by a health care team consisting of 2 paediatricians and 2 nurses in 2 phases. The first one consisted of collecting information on the lifestyle habits of participants by means of the ENHASA questionnaire, previously validated in Spain.26 This questionnaire assesses behaviours and factors involved in the development of overweight and obesity through 26 items rated on a Likert scale. A copy of the questionnaire was distributed to the parents and legal guardians of the participants through the tutors of the students in each school, accompanied by a sheet with information about the study and an informed consent form, which they were asked to submit once it was appropriately completed to include the student in the study. In the second phase, somatometric measurements were obtained for each participant. The health care team travelled to each of the schools, where, in a room arranged specifically for the purpose, they measured the weight, height and waist circumference of the students with a SECA® 778 column scale (min. 2 kg and max 200 kg) and a SECA® 201 measuring tape accurate to 1mm, all of which are certified. After obtaining their assent, students were measured barefoot and in light clothing, with 2 measurements taken for each parameter by the same individual, recording the mean of both. Once all the data was collected, we classified adolescents by their weight status as normal weight or excess weight based on their body mass index (BMI) applying the WHO criteria (BMI z-score: ≤1, normal weight; 1-2, overweight; >2 obesity), the waist-to-height (WTH) ratio and the waist circumference (WC) according to international references for age and sex.27-29 On the other hand, we aimed to assess the pubertal development of the adolescents by means of the Tanner scale. However, after holding meetings between the teaching staff and health experts, this assessment was foregone on account of the inconvenience of performing it outside a health care setting.
Lastly, we conducted an importance-performance map analysis (IPMA) in relation to sex. Prior to it, to verify its appropriateness and guarantee its quality, we conducted a statistical analysis, generating a structural equation model with the partial least squares (PLS) method.30 The thresholds considered valid in this model were a correlation coefficient greater than 0.7 for each item, a p value of less than 0.05 to define statistical significance for each of the 4 dimensions, and a final result with an R2 greater than 0.1. Importance-performance map analysis is a method that plots the relative position of constructs and indicators based on their importance and performance in relation to a specific endogenous variable. The importance is determined by the sum of all the direct and indirect effects on the target endogenous construct, where indirect effects are calculated as the product of the paths linking them to the target construct. Their statistical significance is verified through bootstrapping. As for performance, the first step is to rescale all values for each indicator and subject in the sample to standardise them31,32; then transform their weights by multiplying each rescaled value by its respective rescaled weight, then adding these values up.33 The resulting value is the value of the new rescaled construct.
$$ ξ_i^{rescaled}= frac{E[ξ_i]-min[ξ_i]}{max[ξ_i]-min[ξ_i]}x 100 $$
Where:
$$ min[ξ_i]=∑_{j=1}^{n_i}w_{ij}.min[x_{ij}]$$
$$ max[ξ_i]=∑_{j=1}^{n_i}w_{ij}.max[x_{ij}]$$
And xij stands for the jth manifest variable of a given construct ζi, and wij for the estimated unstandardised formative weights, both of them in the measurement model.34
Once both values are obtained, they are plotted in a map in which the horizontal axis represents importance and the vertical axis performance. Once the importance is calculated, constructs or indicators with high performance values are hard to improve. On the contrary, those with lower performance values may be easier to improve. The statistical analysis was performed with the software SPSS® 18.0 and SmartPLS® 2.0.
RESULTS
Of the 567 year 1 students registered in the census, 421 agreed to participate (participation rate of 74.2%). In the end, after excluding 5 students with conditions that could affect body composition (Turner syndrome, uncontrolled hypothyroidism, trichorhinophalangeal syndrome, maturity-onset diabetes of the young, and reduced mobility in 1 student), the final sample included 416 adolescents, of who 52% were female.
When it came to weight status, we found excess weight in 40.6% based on the BMI, 33.4% based on the WC and 35.1% based on the WTH ratio. We did not find significant differences based on sex.
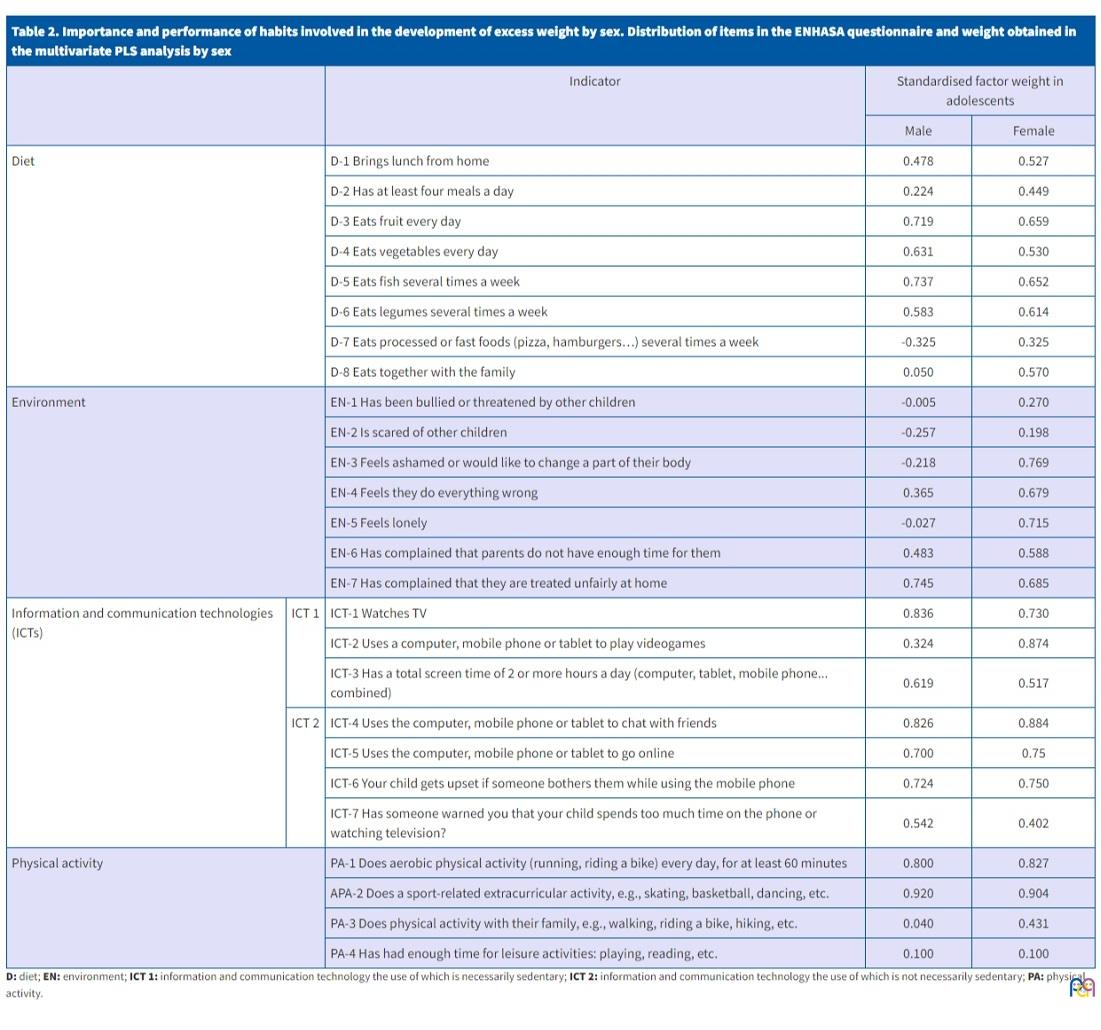
The values obtained in the multivariate analysis based on PLS regression exceeded the required thresholds for the validation of models and scales, fulfilling the criteria for convergent validity in every case. The resulting R2 values were 0.123 for male adolescents and 0.156 for female adolescents, demonstrating the predictive power of the model in both sexes. Table 2 presents all the items in the ENHASA questionnaire, the dimensions in which they are contained and the loading of each item in each sex.
| Table 2. Importance and performance of habits involved in the development of excess weight by sex. Distribution of items in the ENHASA questionnaire and weight obtained in the multivariate PLS analysis by sex | ||||
|---|---|---|---|---|
| Indicator | Standardised factor weight in adolescents | |||
| Male | Female | |||
| Diet | D-1 Brings lunch from home | 0.478 | 0.527 | |
| D-2 Has at least four meals a day | 0.224 | 0.449 | ||
| D-3 Eats fruit every day | 0.719 | 0.659 | ||
| D-4 Eats vegetables every day | 0.631 | 0.530 | ||
| D-5 Eats fish several times a week | 0.737 | 0.652 | ||
| D-6 Eats legumes several times a week | 0.583 | 0.614 | ||
| D-7 Eats processed or fast foods (pizza, hamburgers…) several times a week | -0.325 | 0.325 | ||
| D-8 Eats together with the family | 0.050 | 0.570 | ||
| Environment | EN-1 Has been bullied or threatened by other children | -0.005 | 0.270 | |
| EN-2 Is scared of other children | -0.257 | 0.198 | ||
| EN-3 Feels ashamed or would like to change a part of their body | -0.218 | 0.769 | ||
| EN-4 Feels they do everything wrong | 0.365 | 0.679 | ||
| EN-5 Feels lonely | -0.027 | 0.715 | ||
| EN-6 Has complained that parents do not have enough time for them | 0.483 | 0.588 | ||
| EN-7 Has complained that they are treated unfairly at home | 0.745 | 0.685 | ||
| Information and communication technologies (ICTs) | ICT 1 | ICT-1 Watches TV | 0.836 | 0.730 |
| ICT-2 Uses a computer, mobile phone or tablet to play videogames | 0.324 | 0.874 | ||
| ICT-3 Has a total screen time of 2 or more hours a day (computer, tablet, mobile phone... combined) | 0.619 | 0.517 | ||
| ICT 2 | ICT-4 Uses the computer, mobile phone or tablet to chat with friends | 0.826 | 0.884 | |
| ICT-5 Uses the computer, mobile phone or tablet to go online | 0.700 | 0.75 | ||
| ICT-6 Your child gets upset if someone bothers them while using the mobile phone | 0.724 | 0.750 | ||
| ICT-7 Has someone warned you that your child spends too much time on the phone or watching television? | 0.542 | 0.402 | ||
| Physical activity | PA-1 Does aerobic physical activity (running, riding a bike) every day, for at least 60 minutes | 0.800 | 0.827 | |
| APA-2 Does a sport-related extracurricular activity, e.g., skating, basketball, dancing, etc. | 0.920 | 0.904 | ||
| PA-3 Does physical activity with their family, e.g., walking, riding a bike, hiking, etc. | 0.040 | 0.431 | ||
| PA-4 Has had enough time for leisure activities: playing, reading, etc. | 0.100 | 0.100 | ||
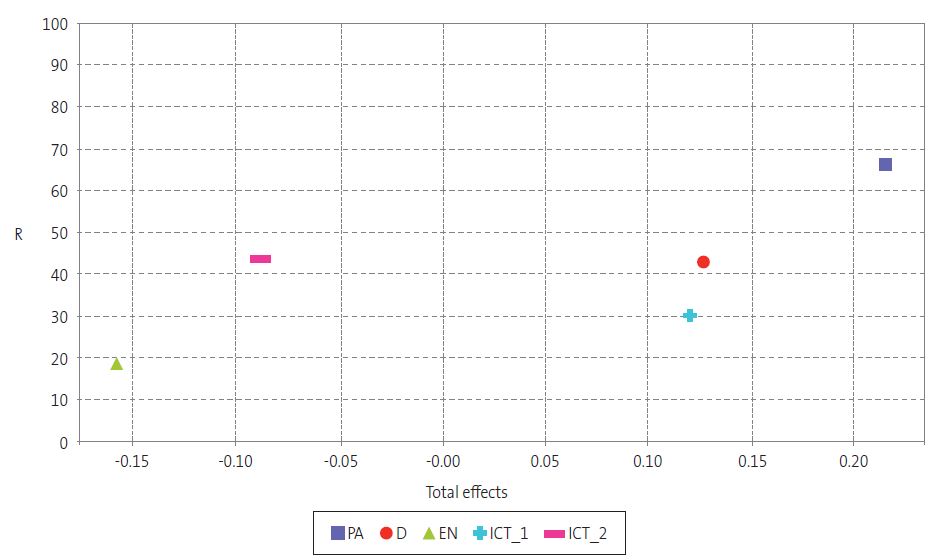
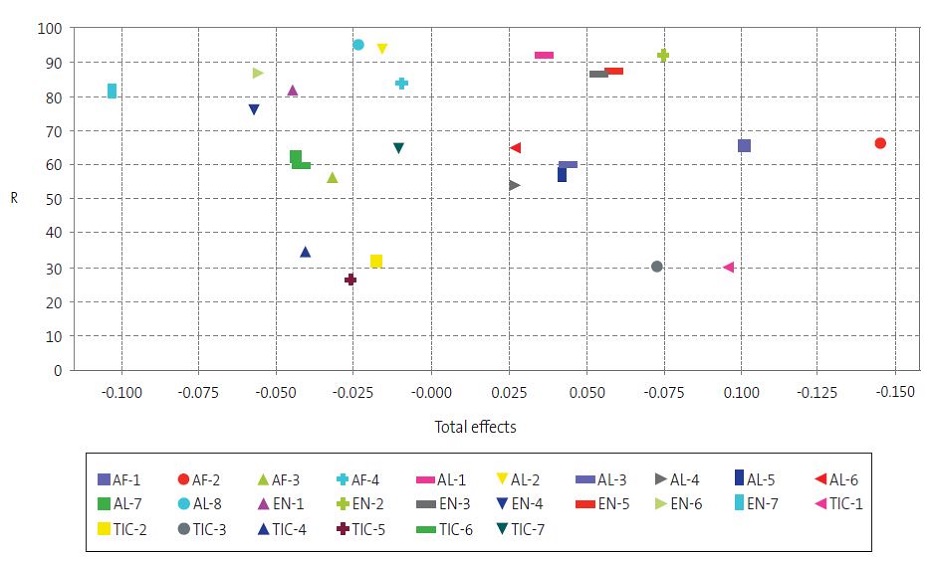
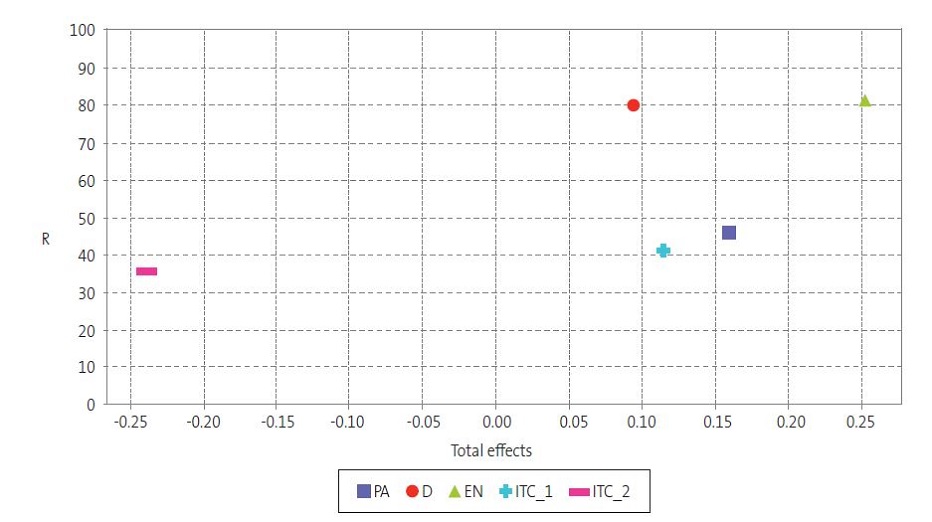
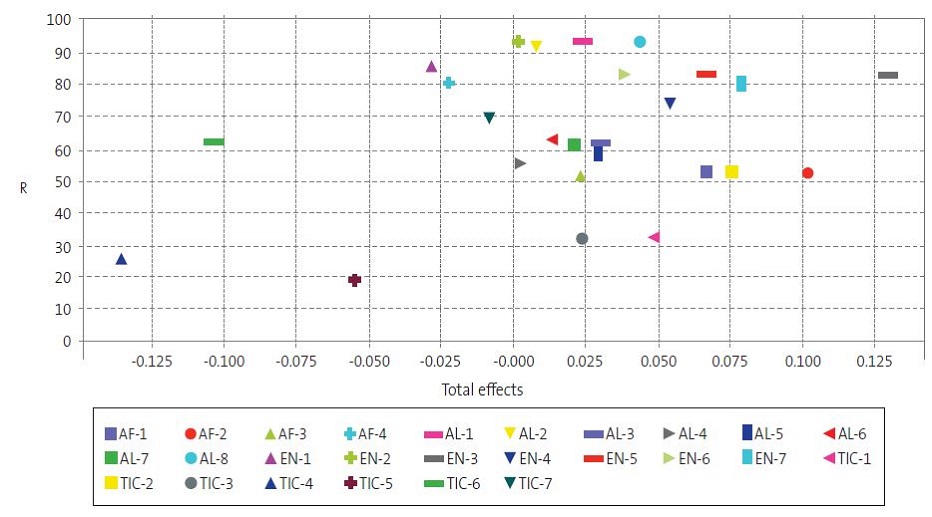
Lastly, the results of the IPMA were as follows. In male adolescents, analysing the overall constructs (Fig. 1), physical activity was identified as the most important dimension, and also had a performance greater than 65%; it was followed in importance, in terms of the tendency to develop excess weight, by diet and the use of technologies that is necessarily sedentary, both with performances of less than 50%. The environment and the use of technologies that is not necessarily sedentary were not very important in male adolescents. Analysing each of the habits under consideration separately (Fig. 2), we found that the most important item was participation in extracurricular sports activities, followed by the habit related to the WHO recommendation of engaging in 60 minutes of daily physical activity, both of which with a performance of nearly 70%. On the other hand, 2 of the indicators that appeared to be most important were watching television and a daily total screentime greater than 2 hours, with a performance of approximately 30%. As for diet, the most influential habits were consuming fruit and consuming fish, with performances of approximately 60%.
| Figure 1. Importance and performance of habits involved in the development of excess weight by sex. Importance-performance map of constructs in male adolescents. Graphical representation of the different risk factors assessed by means of the ENHASA questionnaire in male participants. |
|---|
 |
| Figure 2. Importance and performance of habits involved in the development of excess weight by sex. Importance-performance map of latent variables in male adolescents. Graphical representation of the importance and performance of each of the 26 lifestyle habits assessed in the ENHASA questionnaire in male participants. The correspondence of each of the items can be found in Table 2. |
|---|
 |
In female adolescents, the analysis by dimension (Fig. 3) revealed that the social and school environment was the most important factor, with a performance greater than 80%, followed in importance by physical activity and the use of technologies that is necessarily sedentary, both with a performance of less than 50%. Diet emerged as the fourth most important dimension, with a performance of nearly 80%. In the analysis of individual items (Fig. 4), the desire to change a part of their body was the most important, followed by engagement in extracurricular sports activities and playing video games. As was the case in male adolescents, watching television and the total screen time were important, but had performances of approximately 30%.
| Figure 3. Importance and performance of habits involved in the development of excess weight by sex. Importance-performance map of constructs in female adolescents. Graphical representation of the different risk factors assessed by means of the ENHASA questionnaire in female participants. |
|---|
 |
| Importance and performance of habits involved in the development of excess weight by sex. Importance-performance map of latent variables in female adolescents. Graphical representation of the importance and performance of each of the 26 lifestyle habits assessed in the ENHASA questionnaire in female participants. The correspondence of each of the items can be found in Table 2 |
|---|
 |
DISCUSSION
Generally, we found frequencies of excess weight that were consistent with previous studies that found overweight or obesity in approximately 2 out of 5 children.2,35 This evinces the actual magnitude of the problem of excess weight in the paediatric population.
In our study, we analysed the association between different risk factors and the development of excess weight in adolescents. Although this subject has been studied extensively, we used a novel statistical approach that, by taking performance into account, facilitates the identification of habits that have the most potential for improvement, and yields results in two dimensions (both importance and performance), which is particularly relevant to establish priorities for intervention. In addition, we obtained specific results for each sex, and found differences that should be taken into account in future prevention strategies. On the other hand, given the growing importance of emerging information and communication technologies (ICTs) in the development of excess weight, we decided to divide them into 2 subgroups to make a more detailed analysis. One main subgroup (ICT 1) encompassing those activities that required seating (necessarily sedentary) and a complementary subgroup (ICT 2) encompassing those that did not entail physical inactivity (not necessarily sedentary).
As regards the IPMA, we ought to highlight that the best approach is to focus on improving performance in items found to be very important but which, at the same time, with a relatively low performance, thus addressing those lifestyle habits with the greatest potential for improvement to achieve greater efficiency. In male adolescents, while the factor with the greatest impact on the development of excess weight was physical activity, the lifestyle habits that conformed this dimension had relatively high performance values, and therefore, despite their well-known importance,36,37 did not offer a lot of room for improvement. On the other hand, the items related to the use of necessarily sedentary technologies, such as television viewing or the total hours of screentime, appeared as the third and fourth in importance while their performance was at approximately 30%. Numerous studies have associated the use of emerging technologies with the development of excess weight,38 so, taking into account that at present some portion of learning, communication and entertainment take place through electronic devices, these habits should be addressed thoroughly in upcoming interventions, as they could yield important improvements in the control of obesity. In female adolescents, the factor with the greatest impact on excess weight was the social and school environment, already identified in previous studies,39 and the most relevant item was feeling ashamed or wanting to change some part of their physical appearance. In adolescence, personality develops along with self-esteem and self-image, a process that is more intense in female adolescents.40 Also in this sex, feelings about body image and social acceptance are also stronger, which explains why environmental factors affect female adolescents predominantly in relation to the development of obesity and of mood disorders, low self-esteem or depression.38 Therefore, achieving and maintaining an adequate social and school environment must be one of the main objectives. The second most important item in female adolescents was participation in extracurricular sports activities, and in this sex the performance was approximately 50%, which means that promoting and guaranteeing access to these activities should be another of the priorities in the development of new programmes for obesity control.
Among the strengths of the study, we ought to highlight the objective measurement of somatometric variables with certified equipment and the use of a validated questionnaire. The main limitations were those intrinsic to its cross-sectional design and the characteristics of the sample, which was of small size, recruited in a single health care area by convenience sampling, and further reduction of the sample size by the refusal of some schools to participate. Lastly, we did not take into account parent-related or additional sociodemographic variables that may have acted as confounders.
To conclude, we ought to underscore that our study applied a novel statistical method to analyse the importance and performance of different risk factors associated with excess weight in relation to sex. We analysed classical factors as well as emerging factors such as new technologies or environmental aspects. The factors that appeared to be most important were physical activity in male adolescents and the social and school environment in female adolescents, both of which exhibited a high performance, and therefore offered little room for improvement. Following in importance were diet in male adolescents and physical activity in female adolescents, both with a low performance. Lastly, the use of technologies that was necessarily sedentary corresponded to a high importance and a low performance in both sexes. In consequence, an efficient intervention should address the use of new technologies overall, and aim to improve diet in male adolescents and physical activity in female adolescents. Identifying sex-based differences in behaviours that can have an impact on health must be a priority in the development of new prevention programmes.
CONFLICTS OF INTEREST
The authors have no conflicts of interest to disclose in relation to the preparation and publication of this article.
ABBREVIATIONS
BMI: body mass index · ESO: compulsory secondary education (educación secundaria obligatoria) · IPMA: importance-performance map analysis · OECD: Organisation for Economic Co-operation and Development · PLS: partial least squares · SD: standard deviation · WC: waist circumference · WHO: World Health Organization · WTH: waist-to-height.
ACKNOWLEDGMENTS
Francisco Sánchez Cubo is the beneficiary of a predoctoral grant for the training of researchers in the framework of the Financial Support Programme for the Training of University Teaching Staff of the Ministry of Universities of Spain.
REFERENCES
- Lobstein T, Baur l, Uauy R. Obesity in children and young people: A crisis in public health. Obes Rev Suppl. 2004;5:4-104.
- Agencia Española de Seguridad Alimentaria y Nutrición. Estudio ALADINO 2019: Estudio sobre Alimentación, Actividad Física, Desarrollo Infantil y Obesidad en España 2019. Madrid; 2020 [online] [accessed 03/03/2021]. Available at aesan.gob.es/AECOSAN/docs/documentos/nutricion/observatorio/Informe_Aladino_2019.pdf
- Ezzati M, Bentham J, Di Cesare M, Bilano V, Bixby H, Zhou B, et al. Worldwide trends in body-mass index, underweight, overweight, and obesity from 1975 to 2016: a pooled analysis of 2416 population-based measurement studies in 128·9 million children, adolescents, and adults. 2017;390:2627-42.
- Jiménez Candel MI, Carpena Lucas PJ, Ceballos-Santamaría G, Mondéjar Jiménez J, Monreal Tomás AB, Lozano Pastor VE. Causalidad entre factores de riesgo modificables y sobrepeso en adolescentes de 12-14 años. An Pediatr (Barc). 2021;95:159-66.
- Sharma V, Coleman S, Nixon J, Sharples l, Hamilton-Shield J, Rutter H, et al. A systematic review and meta-analysis estimating the population prevalence of comorbidities in children and adolescents aged 5 to 18 years. Obes Rev. 2019;20:1341-9.
- The Heavy Burden of Obesity: The Economics of Prevention. In: OECD Health Policy Studies. OECD Publishing, Paris; 2019 [online] [accessed 03/03/2021]. Available at oecd.org/health/the-heavy-burden-of-obesity-67450d67-en.htm
- Whitlock EP, Williams SB, Gold R, Smith PR, Shipman SA. Screening and interventions for childhood overweight: A summary of evidence for the US Preventive Services Task Force. Pediatrics. 2005;116:e125-e144.
- Barja S, Loyola M, Ortiz C, Araneda Y, Undurraga R. Un programa de prevención temprana de la obesidad: “HaViSa UC” (2009-2019). Rev Chil Pediatría. 2020;91:353-62.
- Waxman A, World Health Assembly. World Health Organization Global Strategy on Diet, Physical Activity and Health. Food Nutr Bull. 2004;25:292-302.
- Ballesteros Arribas JM, Dal-Re Saavedra M, Pérez-Farinós N, Villar Villalba C. La estrategia para la nutrición, actividad física y prevención de la obesidad (Estrategia Naos). Rev Esp Salud Pública. 2007;81:443-9.
- García A, Aspillaga C, Cruzat Mandich C, Barja S. Recomendaciones de padres de niños obesos en tratamiento para el equipo de salud: estudio cualitativo. Rev Chil Pediatría. 2017;88:495-501.
- De Onis M, Blössner M, Borghi E. Global prevalence and trends of overweight and obesity among preschool children. Am J Clin Nutr. 2010;92:1257-64.
- Redinger RN. The prevalence and etiology of nongenetic obesity and associated disorders. South Med J. 2008;101:395-9.
- Jiménez Boraita R, Gargallo Ibort E, Dalmau Torres JM, Arriscado Alsina D. Gender Differences Relating to Lifestyle Habits and Health-Related Quality of Life of Adolescents. Child Indic Res. 2020;13:1937-51.
- Galan Lopez P, Sanchez Oliver AJ, Pihu M, Gísladóttír T, Domínguez R, Ries F. Association between adherence to the Mediterranean diet and physical fitness with body composition parameters in 1717 European adolescents: The adoleshealth study. Nutrients. 2020;12:77.
- Santiago S, Cuervo M, Zazpe I, Ortega A, García Perea A, Martínez JA. Situación ponderal, hábitos alimentarios y deportivos en población castellano-manchega de 6 a 12 años. An Pediatr (Barc). 2014;80:89-97.
- Gutierrez Hervasa A, Cortés Castell E, Juste Ruíz M y Rizo Baeza M. Qué variables influyen en el cumplimiento de las recomendaciones de actividad física en preescolares? An Pediatr (Barc). 2020;92:156-64.
- Ahrens W, Pigeot I, Pohlabeln H, De Henauw S, Lissner l, Molnár D, et al. Prevalence of overweight and obesity in European children below the age of 10. Int J Obes. 2014;38:S99-S107.
- Vernetta Santana M, Peláez EM, Ariza l, López Bedoya J. Dieta mediterránea, actividad física e índice de masa corporal en adolescentes rurales de Granada (España). Nutr Clín Diet Hosp. 2018;38:71-80.
- Rosa Guillamón A, Carrillo López PJ, García Cantó E, Perez Soto JJ, Tarraga Marcos l, Tarraga López PJ. Mediterranean diet, weight status and physical activity in schoolchildren of the Region of Murcia. Clín Investig Arterioscler. 2019;31:1-7.
- Mera Gallego R, García Rodríguez P, Fernández Cordeiro M, Rodríguez Reneda A, Vérez Cotelo N, Andrés-Rodríguez N, et al. Factores de riesgo cardiovascular en adolescentes escolarizados (RIVACANGAS). Endocrinol Nutr. 2016;63:511-8.
- Social Determinants of Health and Well-Being among Young People. Health Behaviour in School-Aged Children (HBSC) Study: International Report from the 2009/2010 Survey. In: WHO. Health Policy for Children and Adolescents, No. 6; 2012 [online] [accessed 03/03/2021]. Available at https://apps.who.int/iris/handle/10665/326406
- Wärnberg J, Pérez Farinós N, Benavente Marín JC, Gómez SF, Labayen I, G Zapico A, et al. Screen Time and Parents’ Education Level Are Associated with Poor Adherence to the Mediterranean Diet in Spanish Children and Adolescents: The PASOS Study. J Clin Med. 2021;10:795.
- Sabater Fernández C, Fernández Alcalde JB. No, sin mi móvil. Diferencias de género y uso de las nuevas tecnologías. ICONO. 2015;13:208-46.
- Hernando Á, Oliva A, Ángel Pertegal M. Diferencias de género en los estilos de vida de los adolescentes. Psychosoc Interv. 2013;22:15-23.
- Jiménez Candel MI, Carpena Lucas PJ, Ceballos-Santamaría G. Design and validation of a questionnaire to study healthy habits among adolescents aged 12-14 years. Arch Argent Pediatr. 2021;119:177-84.
- De Onis M, Garza C, Onyango AW, Martorell R (eds.). WHO child growth standards. Acta Paediatr. 2006; 95:5-101.
- WHO Multicentre Growth Reference Study Group. WHO Child Growth Standards based on length/height, weight and age. Acta Paediatr Suppl. 2006;450:76-85.
- Marrodán MD, Martínez Álvarez JR, González Montero de Espinosa ML, López Ejeda N, Cabañas MD, Pachecho JL, et al. Estimación de la adiposidad a partir del índice cintura talla: Ecuaciones de predicción aplicables en población infantil Española. Nutr Clin Diet Hosp. 2011;31:45-51.
- Moreno LA, Mesana MI, González Gross M, Gil CM, Ortega FB, Fleta J, et al. Body fat distribution reference standards in Spanish adolescents: The AVENA Study. Int J Obes. 2007;31:1798-805.
- Carpena Lucas PJ, Jiménez Candel MI, Sánchez Cubo F, Ceballos Santamaría G, Vargas Vargas M, Mondéjar Jiménez J. Gender differences in the development of childhood obesity in young teenagers in Murcia, Spain. Pediatr Int. 2022;64:e15065.
- Höck C, Ringle CM, Sarstedt M. Management of multi-purpose stadiums: Importance and performance measurement of service interfaces. Int J Serv Technol Manag. 2010;14:188-207.
- Anderson EW, Fornell C. Foundations of the American Customer Satisfaction Index. Total Qual Manag. 2000;11:869-82.
- Ringle CM, Sarstedt M. Gain more insight from your PLS-SEM results: The importance-performance map analysis. Ind Manag Data Syst. 2016;116:1865-86.
- Fornell C, Johnson MD, Anderson EW, Cha J, Bryant BE. The American Customer Satisfaction Index: Nature, purpose, and findings. J Mark. 1996;60:7-18.
- Espin Riosa MI, Pérez Flores D, Sánchez Ruiz JF, Salmerón Martinez D. Prevalencia de obesidad infantil en la Región de Murcia, valorando distintas referencias para el indice de masa corporal. An Pediatr (Barc). 2013;78:374-81.
- Mesas AE, Guallar-Castillón P, León-Muñoz LM, Graciani A, López-García E, Gutiérrez-Fisac JL, et al. Obesity-Related Eating Behaviors Are Associated with Low Physical Activity and Poor Diet Quality in Spain. J Nutr. 2012;142:1321-8.
- Global recommendations on physical activity for health. In: WHO. 2010 [online] [accessed 01/10/2022]. Available at who.int/dietphysicalactivity/factsheet_recommendations/en/
- García Continente X, Allué N, Pérez Giménez A, Ariza C, Sánchez Martínez F, López MJ, et al. Hábitos alimentarios, conductas sedentarias y sobrepeso y obesidad en adolescentes de Barcelona. An Pediatr (Barc). 2015;83:3-10.
- Herranz Barbero A, López De Mesa MR, Azcona San Julián C. Influencia del exceso de peso en la calidad de vida relacionada con la salud de los adolescentes. An Pediatr (Barc). 2015;82:131-8.
- Ying-Hui Quek, Wilson W S Tam, Melvyn W B Zhang, Roger C M Ho. Exploring the association between childhood and adolescent obesity and depression: a meta-analysis. Obes Rev. 2017;18:742-54.