

Excess weight in children and adolescents: modifiable factors, genetic inheritance and body image perception
Ismael San Mauro Martína, Elena Garicano Vilara, Marta Cordobés Rola, Paula Díaz Molinaa, Vanesa Cevallosa, Diana Pina Ordúñeza, Víctor Paredes Baratoa
aCentros de Investigación en Nutrición y Salud (Grupo CINUSA). Madrid. España.
Correspondence: I San Mauro. E-mail: research@grupocinusa.com
Reference of this article: San Mauro Martín I, Garicano Vilar E, Cordobés Rol M, Díaz Molina P, Cevallos V, Pina Ordúñez D, et al. Excess weight in children and adolescents: modifiable factors, genetic inheritance and body image perception. Rev Pediatr Aten Primaria. 2016;18:e199-e208.
Published in Internet: 22-11-2016 - Visits: 25980
Abstract
Introduction: overweight and obesity achieve a high prevalence among children and adolescents in Spain. Modifiable habits, combined with the genetic load and weight perception, declines over the years making children overweight adults. Our aim was to analyze the relevance in excess weight of various modifiable factors (dietary habits, physical activity, sedentary lifestyle and sleep), heredity and body image perception in children and adolescents.
Methods: a retrospective observational study of 101 schoolchildren in Madrid (mean age 10 years) was performed with collection of anthropometric (weight, height, skinfold thickness and waist circumference), dietary (KidMed), physical activity (IPAQ adapted), sedentary lifestyle, sleep and perception of weight and body image data.
Results: 31% of children had excess weight. 53.4% needed diet improvement. The number of participants with normal weight who did not follow a high adherence to the Mediterranean diet was greater than those with overweight-obesity who did adhered. No statistically significant results between weight status (according to weight percentile) and body parental characteristics were obtained, but according to BMI. 70% of obese and 50% of malnourished would like to stay in their weigh.
Conclusion: modifiable factors were not associated with an increased excess weight. Parents’ weight had some influence on the weight status of children, although no statistically significant results were obtained when both modifiable factors and heredity were analyzed altogether.
Keywords
● Body image ● Energy balance ● Excess weight ● Genetic heritage ● HabitsINTRODUCTION
Obesity is a multifactorial chronic disease that usually has onset in childhood and adolescence. It results from an imbalance between energy intake and expenditure and other factors, leading to the accumulation of body fat.1 In Spain, the National Health Survey of 2012 reported a prevalence of excess weight of 27.8% in the population aged less than18 years (18.3% had overweight and 9.6% obesity).2 This is currently an important public health problem.
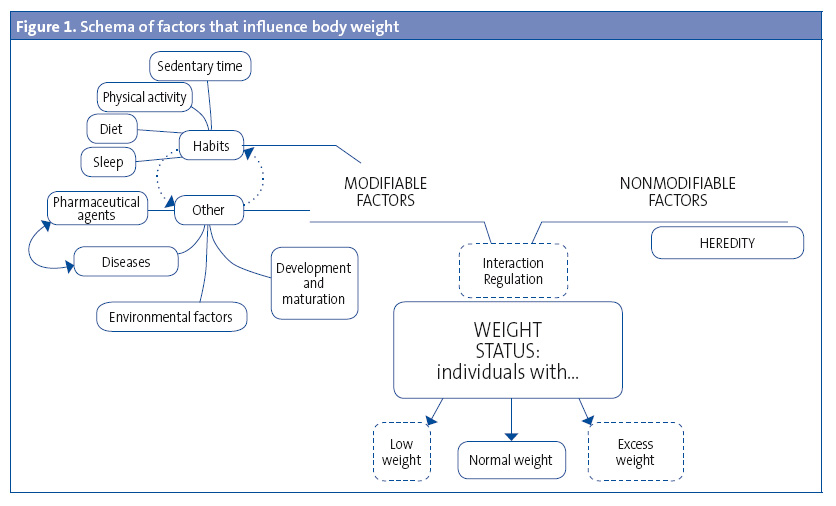
The most relevant of all the environmental factors that influence excess weight (Figure 1) are those considered modifiable due to the potential for sociocultural and health care interventions, and include dietary habits,3 physical activlity,4 sedentary time,5 family influences6 and sleep quality.3
Chief among the dietary habits are a high fat intake (> 38%), high consumption of sugary drinks, pastries and cold cuts and low consumption of fruits and vegetables.7 Some authors propose that the distribution of energy intake throughout the day is relevant in weight control, and recommend three full meals and two snacks a day.8 An inadequate breakfast in children has been associated with a mild increase in weight and changes in habits and daily intakes, in addition to a higher body mass index (BMI).9
At present, sedentary habits are a key factor in the reduction of energy expenditure, manifested in greater amounts of time spent watching television and with other electronic devices.10
Sleep duration is an important factor in the development of childhood obesity. There is evidence of an association between abnormal sleep patterns and weight gain.11
Last of all, genetic factors can also modulate the response to changes in energy intake and expenditure.12 Recent genomic studies have identified loci associated with obesity or BMI and waist and hip circumferences that explain a small proportion of the heritability of obesity.13 Estimations of heritability (the proportion of the phenotypic variability of a given feature that can be attributed to genetic variation) range between 40% and 70% based on family and twin studies. Thus, parental genetics have a significant influence on the predisposition for obesity.14
The aim of our study was to analyse the relevance of various modifiable and unmodifiable factors and of genetic inheritance in excess weight in children and adolescents, as well as in their body image perception.
MATERIALS AND METHODS
Population under study: we recruited a convenience sample of 101 individuals in a school in Madrid. The inclusion criterion was age 6 to 17 years. We excluded children that did not complete the questionnaire (n = 5) or the anthropometric evaluation (n = 8), or did not provide a signed informed consent (n = 0). The final sample consisted of 88 schoolchildren (41 male and 47 female) with a mean age of 10.46 ± 3.03 years. All participants and their parents or legal guardians were informed of the objectives of the study and signed an informed consent form agreeing to participate.
Participants were asked about their physical activity and sedentary habits using validated questionnaires such as an adapted version of the International Physical Activity Questionnaire (IPAQ®)15 and the KidMed®16 questionnaire, and also underwent an anthropometric evaluation.
Anthropometric evaluation: the anthropometric measurements taken first thing in the morning were: weight, height, triceps and subscapular skinfold thickness and waist circumference. Weight was measured with a Tanita® BP-601 bioelectric impedance body composition monitor with a range of 0.1 to 150 kg. The height was measured with a portable SECA® stadiometer accurate to 1mm, conforming to the recommendations of the World Health Organization (WHO).17 Skinfolds were measured with a SECA® skinfold calliper. The waist circumference was measured at the midpoint between the lowest rib and the iliac crest with inelastic tape measures (range, 0–150 cm). The BMI was calculated from the weight and height using the equation for the Quetelet index.18 To estimate the prevalence of overweight and obesity, we compared the weights of participants with the growth charts of the Instituto de Investigación sobre Crecimiento y Desarrollo of the Fundación Orbegozo19. Based on these tables, overweight corresponds to a weight above the 85th percentile and below the 97th percentile for age and sex, while obesity corresponds to a weight above the 97th percentile. The term “excess weight” corresponds to the composite of overweight and obesity.
Assessment of physical activity: we assessed physical activity by means of the IPAQ®15, documenting the intensity of exertion both during their main occupation and during leisure time. We set the lower threshold at 60 minutes of physical activity, recommended by the WHO for the population aged 5 to 17 years.20 To assess adherence to the recommendations of the Spanish Agency for Consumer Affairs, Food Safety and Nutrition (Agencia Española de Consumo, Seguridad Alimentaria y Nutrición [AECOSAN])21 on the hours of sedentary activity, we added the hours spent using computers, watching television and reading, categorising children that spent two hours or more a day on these activities as sedentary.
Assessment of sleep quality: we assessed sleep quality by recording the number of hours of sleep, including naps, during weekdays and in the weekend. We compared the mean hours of sleep with the hours recommended in the Clinical Practice Guideline for Sleep Disorders,22 according to which school-aged children need ten hours of sleep a day.
Dietary assessment: we used the KidMed® index, which assesses adherence to the Mediterranean diet in children and adolescents. The possible total score ranges between 0 and 12 and allows the classification of individuals into one of three groups: ≤ 3, very poor diet; 4–7, need to adjust dietary pattern to better fit the Mediterranean model; and ≥ 8, optimal Mediterranean diet. We grouped the first two (0–7 points) into a single category of “non-adherence”, and considered scores of 8 or greater as “adherence.” Participants also filled out a weekly food diary after being provided with the necessary directions.
Assessment of body image and weight perception: to evaluate the impact of genetic heritability in excess weight, which we assessed based on the subjective perception of participants, we asked the latter how they perceived their parents’ weight. To do so, we used the Standard Figural Stimuli,23 a scale consisting of nine figures or silhouettes, male or female, going from slim to obese. We considered the following three groups in the assessment of weight by height of the father and mother: low weight for perceptions of 1 to 2, normal weight for perceptions of 3 to 5, and overweight-obesity for perceptions of 6 to 9. We considered each parent separately and also the mean for both. To assess psychological behaviour, we asked participants about their weight.
Statistical analysis: we performed descriptive analyses, expressing results as means, standard deviations and percentages. We used parametric statistical tests—Student’s t and ANOVA—to analyse the difference between the means of two groups for quantitative variables, and the χ2 and Wilcoxon rank-sum tests for qualitative variables that did not follow a normal distribution. Comparisons with a p-value of less than .05 were considered statistically significant. We analysed the data with SPSS® (version 20).
RESULTS
The sample consisted of 88 students (47 female and 41 male) aged 6 to 17 years, with a mean age of 10.46 ± 3.03 years. Their mean weight was 40.34 ± 12.8 kg, the mean weight percentile was 65.36 ± 25.81 and the mean waist circumference was 63.8 cm (Table 1). Of all participants, 66.7% had normal weight, 19.5% overweight, 11.5% obesity and 2.3% mild malnutrition. We found significant differences in the triceps skinfold, the subscapular skinfold and waist circumference based on weight status.
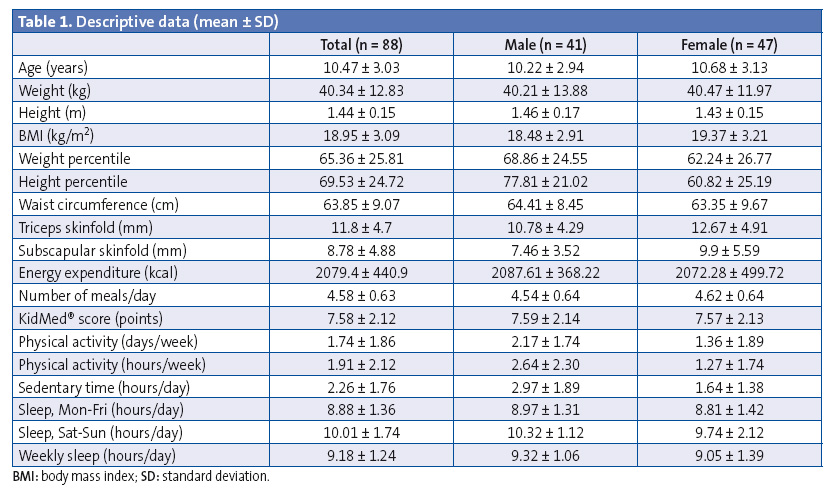
Table 1 shows how participants engaged in 1.74 ± 1.8 hours of physical activity a week and slept an average of 8.8 hours a night Monday through Friday and 10 hours a night on weekends.
The mean KidMed® score was 7.58 ± 2.12 points. In qualitative terms, 53.41% needed to improve their diets. Of all participants, 2.27% had a score of less than 3, 51.14% a score between 4 and 6, and 46.59% a score greater than 7.
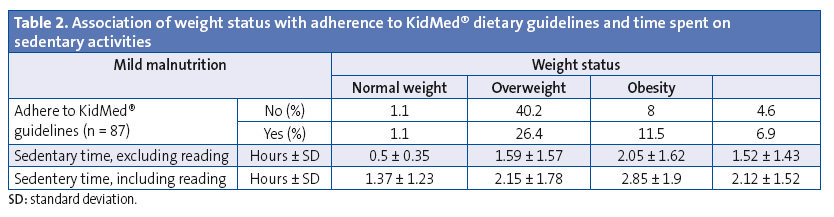
Table 2 explores the association between different weight status groups (by weight percentile) and adherence to the Mediterranean diet. We observed that more participants with normal weight did not adhere to the Mediterranean diet than did adhere, while the percentage of male and female participants with overweight or obesity that adhered to the Mediterranean diet exceeded the percentage of those that did not, although these findings were not statistically significant (χ2 = 2.868; P = .413).
The analysis of the energy intake of participants showed that 50% of those with normal weight had an intake that exceeded their energy requirements, which was also the case in 63% of overweight participants. Fifty percent of obese participants had intakes below their energy requirements.
The mean number of eating occasions a day was 4.58, with a mean energy intake of 2098.60 ± 445.63 kcal. Of all participants, 65.9% reported the recommended five eating occasions a day, while a mere 8% had only three meals a day; we ought to highlight that all children (100%) ate breakfast. Of all participants, 19.3% did not eat any fruit, and 45.4% ate less than two pieces of fruit a day. Furthermore, 31.0% did not eat a single serving of vegetables a day, and only 20.5% ate at least two servings a day. We found no significant differences in vegetable consumption between the sexes (χ2 = 5.999; P = .14): 61.67% of females ate at least one serving of vegetables a day compared to 38.33% of males.
Table 2 also shows the association between weight status and sedentary time, although our findings were not statistically significant. It is worth noting that based on weight percentile, participants that were overweight spent more time in sedentary activities than participants in other groups, exceeding the recommended number of hours (and excluding hours spent reading). When we took hours spent reading into account, all groups (except the malnutrition group) exceeded the recommended daily sedentary time.
We also asked participants about the physical characteristics of their parents, presenting them with silhouettes to point out how they perceived the bodies of their father and mother. Later on, we compared these with the weight status of the participants to determine whether there was a subjective association between the two. In our sample, both male and female participants perceived their parents to have normal weight (mean figure perception, 4.50 ± 1.06). We did not find statistically significant differences between the data reported by male (4.62 ± 1.08) and female participants (4.40 ± 1.04). Therefore, we did not find statistically significant associations between weight status (based on body weight percentile) and the physical characteristics of the parents (father, mother, and both) (Table 3).
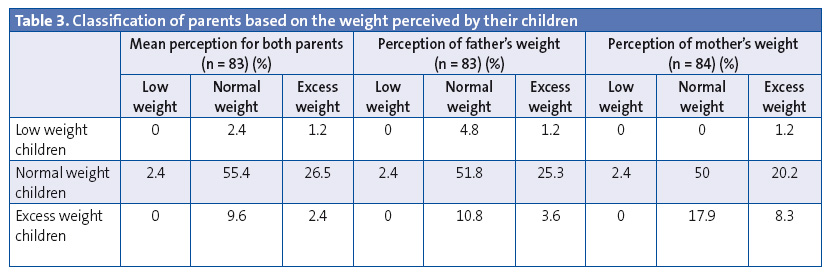
On the other hand, when we analysed participants by BMI, we did not observe significant differences in the classification of both parents combined and the weight status of their children (χ2 = 19.464; P = 0.13), although this approach is not valid for this sample, as the weight status of school-aged children is based on their weight percentile and not on the adult BMI classification.
We also did not find statistically significant associations between adherence to recommendations regarding physical activity, sedentary time and the Mediterranean diet and the classification of parents by the weight subjectively perceived by their children. Therefore, we did not find conclusive data regarding heritability in our sample, given the subjectivity of the data and the lack of actual anthropometric data for the parents.
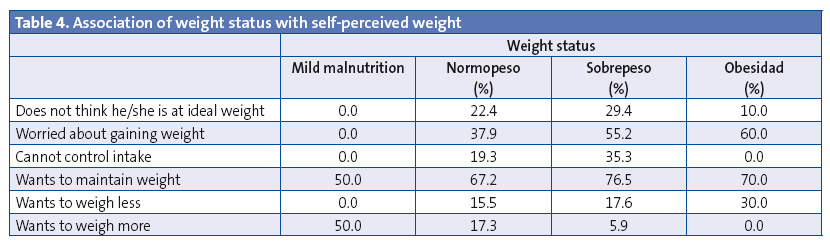
Table 4 shows the association of the students’ weight status with their subjectively perceived body weight. Our findings were not statistically significant. Most students in the sample (78.2%) believed they were at their ideal weights. Of the remaining 21.8%, 14.9% of the total had normal weight and only 1.1% was obese. On the other hand, we ought to note that 70% of obese participants and 50% of participants with malnutrition reported they would like to maintain their weight, and that none of the students with obesity or malnutrition reported being unable to control their intake. We found that 59.6% of the female students had at some point worried about gaining weight, compared to 29.3% of male students (χ2 = 8.826; P = .12).
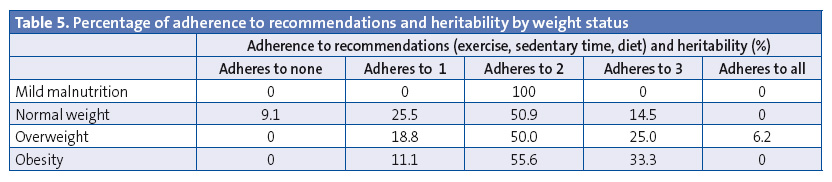
Finally, we assessed adherence to various recommendations, physical activity, sedentary time, diet and heritability of weight status in combination and separately, and created a classification. Table 5 compares this score to the weight status of the students, although these findings were not statistically significant. Only one of the children (with overweight) presented all four factors.
DISCUSSION
Spain ranks among the top countries in obesity and overweight according to the THAO study,24 which analysed a sample of 38 008 schoolchildren aged 3 to 12 years of who 21.7% had obesity and 8.3% overweight. According to the ALADINO study,8 the prevalence of overweight and obesity in children aged 5 to 7 years is 12.4% and 13.9%, respectively. The findings in our sample were not as encouraging: 19.5% was overweight and 11.5% suffered from obesity, and this trend seems to be on the increase.
In a study conducted by Zapico25 (2010), adherence to the Mediterranean diet was assessed using the KidMed® questionnaire. Of all participants, 14.5% had a very poor diet, 54.2% a diet that could be improved, and 31.3% an optimal Mediterranean diet. The distribution was less favourable in female participants, of who 17.2% had a very poor diet compared to 11.8% of males. The BMI ranged from 20.19 to 22.52 in females and from 20.58 to 23.26 kg/m2 in males. Overweight, defined as BMI greater than the 85th percentile, ranged between 24.0 and 26.6 in males (17.3% of the sample), and between 23.6 and 25.7 in females (17.5%). Lastly, the percent body fat ranged from 24.77% to 27.94% in females, and from 18.26% to 3.08% in males.
In our sample, the mean KidMed® score was 7.58 points, which was very similar to the data obtained by Pérez-Gallardo in 2011 (7.6 ± 1.2).26 Of all participants, 54.02% had a less-than-adequate score, and 45.8% an adequate score.
When we compared the diet with the anthropometric status of the participants we found that of the 54.02% of students that did not have an optimal diet based on the KidMed® score, 61.7% had a normal weight. Therefore, we were unable to establish a clear association between diet and weight by means of the KidMed® questionnaire (χ2 = 4.545; P = .603). Only 10% of obese participants in our sample seemed to be dissatisfied with their weight status. In fact, Hernández et al27 (2015) noted that adolescents have a difficult time assessing their own body weight. In the sample of students in their study (n = 87), 27.48% misperceived their own weight, which the authors remarked was consistent with the findings of previous studies.
López-López et al28 (2013) reported that 22.3% out of 800 adolescents had a very low-quality diet, 52.9% dietary habits that could be improved, and 24.9% an optimal Mediterranean diet, as well as a positive correlation of diet with the level of physical activity. Adolescents with higher levels of moderate or vigorous physical activity exhibited greater adherence to the optimal Mediterranean diet pattern. In our study, 21.6% of participants with a low-quality diet (KidMed® score < 8) did not exercise a single day a week, compared to 19.3% of participants that followed an optimal Mediterranean diet. Only 1.14% of the sample adhered to physical activity recommendations and also to an optimal Mediterranean diet (KidMed® score > 8).
As for physical activity and sedentary time, we observed that students in our sample engaged in an average of 1.91 ± 2.12 hours of physical activity a week. We ought to note that those that were overweight or obese reported greater amounts of sedentary time compared to participants with normal weight, with mean sedentary times of 2.15 hours in participants with normal weight, 2.85 hours in participants with overweight, and 2.12 hours in participants with obesity. Santaliestra-Pasías et al29 (2013) stated that at present, a majority of children and adolescents spend most of their leisure time in sedentary activities: on average, 1.8 to 2.8 of hours of television a day, depending on age and sex.
When we analysed the hours of sleep in our sample by weight status, we found that the mean number of hours slept a day each week was 9.21 in malnourished participants, 9.05 hours in participants with normal weight, and 9.45 and 9.44 hours in participants with overweight and obesity, respectively. However, the differences were not statistically significant, so we had to rule out an association between weight gain and sleep duration in this sample. These results contradict the findings of other studies30 that have found a potential association between sleep deprivation and increases in BMI. Furthermore, Taheri et al31 (2006) found that children that sleep less than recommended are more likely to be obese. One of the reasons proposed by the authors is that fatigue alters the levels of the hormones that regulate appetite, leading children to eat more.
Children with a family history of overweight may be genetically predisposed to the disease, especially if they have easy access to high-energy foods and they are not encouraged to exercise.32. Among other authors, Lindsay et al33 (2006) analysed the role of parenting in the development of overweight and obesity prevention. Successful intervention efforts, they concluded, must involve and work directly with parents from the earliest stages of child development to support healthful practices both in and outside of the home.
Magarey et al34 (2003) analysed the risk of obesity in early adulthood in association with a history of childhood obesity or of obesity in one or both parents. In the first study, they concluded that obese children aged less than 3 years whose parents are not obese are at low risk of obesity in adulthood, but that in older children, current obesity is an increasingly significant risk factor for obesity in adulthood, independent of parental obesity. Parental obesity more than doubled the risk of future adulthood obesity in obese and non-obese children aged less than 10 years. The second study demonstrated that weight status at early ages is a stronger predictor of weight status at age 20 years than parental weight status, and that the risk of overweight at age 20 years increases even more with increasing parental weight.
In conclusion, we did not find an association between modifiable factors (diet, exercise, sleep and sedentary habits) and greater excess weight. Parental weight had some impact on the weight status of children, although we did not find statistically significant results in the analysis of either modifiable factors (physical activity, sedentary time, diet) or unmodifiable factors (heritability) as a whole, so further research is required with recruitment of larger samples to assess for a potentially stronger association. Due to the growing importance of childhood obesity in developed countries, we have to analyse every possible factor, modifiable and unmodifiable, for the purpose of developing more effective strategies for the primary and secondary prevention of this disease.
CONFLICTS OF INTEREST
The authors have no conflicts of interest to declare in relation to the preparation and publication of this article.
ABBREVIATIONS: AECOSAN: Agencia Española de Consumo, Seguridad Alimentaria y Nutrición · BMI: body mass index · IPAQ: international physical activity questionnaire · WHO: World Health Organization.
REFERENCES
- Ruiz E, Ávila JM, Valero T, del Pozo S, Rodríguez P, Aranceta-Bartrina J, et al.Energy intake, profile, and dietary sources in the Spanish population: findings of the ANIBES Study. Nutrients. 2015;7:4739-62.
- Sabadini Piva L, Reig García-Galbis M. Programas de intervención dietética para la pérdida de peso en edades de 2 a 17 años. Revisión sistemática. Nutr Clín Diet Hosp. 2015;35:63-70.
- San Mauro I, Megias A, García de Angulo B, Bodega P, Rodríguez P, Grande G, et al.Influencia de hábitos saludables en el estado ponderal de niños y adolescentes en edad escolar. Nutr Hosp. 2015;31:1996-2005.
- Valdés-Badilla P, Godoy-Cumillaf A, Herrera-Valenzuela T, Álvarez Mancilla M, Durán Agüero S. Asociación entre estado nutricional y tiempo de actividad física escolar de niños y niñas chilenos de 4 a 14 años. Nutr Clín Diet Hosp. 2014;34:57-63.
- LeBlanc AG, Katzmarzyk PT, Barreira TV, Broyles ST, Chaput JP, Church TS, et al.Correlates of total sedentary time and screen time in 9-11 year-old children around the world: the international study of childhood obesity, lifestyle and the environment. PLoS One. 2015;10:e0129622.
- Assari S, Caldwell CH, Zimmerman MA. Low parental support in late adolescence predicts obesity in young adulthood; Gender differences in a 12-year cohort of African Americans. J Diabetes Metab Disord. 2015;14:47.
- Alba Tamarit E, Gandía Balaguer A, Olaso González G, Vallada Regalado E, Garzón Farinós MF. Consumo de frutas, verduras y hortalizas en un grupo de niños valencianos de edad escolar. Nutr Clín Diet Hosp. 2012;32:64-71.
- Pérez-Farinós N, López-Sobaler AM, Dal Re MÁ, Villar C, Labrado E, Robledo T, et al.The ALADINO study: a national study of prevalence of overweight and obesity in Spanish children in 2011. Biomed Res Int. 2013;2013:163687.
- Burrows AR. Prevención y tratamiento de la obesidad desde la niñez: la estrategia para disminuir las enfermedades crónicas no transmisibles del adulto. Rev Med Chile. 2000;128:105-10.
- Pérez EC, Sandoval MJ, Schneider SE, Azula LA. Epidemiología del sobrepeso y la obesidad en niños y adolescentes. Rev Posgrado VI Cátedra Med. 2008;179:16-20.
- Monereo S. El exceso de peso en el mundo: causas y consecuencias de la obesidad. In: Monereo S, Iglesias P, Guijarro G. Nuevos retos en la prevención de la obesidad. Tratamientos y calidad de vida. Bilbao: Fundación BBVA; 2012.
- O’Rahilly S, Farooqi IS. The genetics of obesity in humans. In: De Groot LJ, Beck-Peccoz P, Chrousos G, Dungan K, Grossman A, Hershman JM, et al.(eds.). Endotext. South Dartmouth (MA): MDText.com; 2000.
- Bradfield JP, Taal HR, Timpson NJ, Scherag A, Lecoeur C, Warrington NM, et al.A genome-wide association meta-analysis identifies new childhood obesity loci. Nat Genet. 2012;44:526-31.
- Wahlqvist ML, Krawetz SA, Rizzo NS, Dominguez-Bello MG, Szymanski LM, Barkin S, et al.Early-life influences on obesity: from preconception to adolescence. Ann N Y Acad Sci. 2015;1347:1-28.
- Booth, M.L. Assessment of physical activity: an international perspective. Res Quarterly Exercise Sport. 2000;71:114-20.
- Serra Majem L, Ribas Barba L, Ngo de la Cruz J, Ortega Anta RM, Pérez Rodrigo C, Aranceta Bartrina J. Alimentación, jóvenes y dieta mediterránea en España. Desarrollo del KIDMED, índice de calidad de la dieta mediterránea en la infancia y la adolescencia. In: Serra Majem L, Aranceta Bartrina J (eds). Alimentación infantil y juvenil. Estudio enKid. 1.ª edición. Barcelona: Masson; 2002. p. 51-9.
- Waist circumference and waist-hip ratio. In: Organización Mundial de la Salud [online] [consulted on 15/11/2016]. Available in www.who.int/nutrition/publications/obesity/WHO_report_waistcircumference_and_waisthip_ratio/en/
- Durnin JVGA, Fidanza F. Evaluation of nutritional status. Bibl Nutr Dieta. 1985;35:20-30.
- Hernández M, Castellet J, Narvaiza JL, Rincón JM, Ruiz I, Sánchez E, et al.Curvas y tablas de crecimiento. Instituto de Investigación sobre Crecimiento y Desarrollo, Fundación Faustino Orbegozo. Madrid: Editorial Garsi; 1988.
- Recomendaciones mundiales sobre la actividad física para la salud. In: Organización Mundial de la Salud [online] [consulted on 15/11/2016]. Available in www.who.int/dietphysicalactivity/physical-activity-recommendations-5-17years.pdf?ua=1
- Programa piloto escolar de referencia para la salud y el ejercicio contra la obesidad (PERSEO, 2006). In: Organización Médica Colegial de España [online] [consulted on 15/11/2016]. Available in www.cgcom.es/sites/default/files/PROGRAMA-2_0.pdf
- Grupo de trabajo de la Guía de Práctica Clínica sobre Trastornos del Sueño en la Infancia y Adolescencia en Atención Primaria (GPC). Guía de Práctica clínica sobre trastornos del sueño en la infancia y adolescencia en Atención Primaria. Plan de Calidad para el Sistema Nacional de Salud del Ministerio de Sanidad, Política Social e Igualdad. Unidad de Evaluación de Tecnologías Sanitarias de la Agencia Laín Entralgo; 2011UETS N.º 2009/8. Available in www.guiasalud.es/GPC/GPC_489_Trastorno_sueño_infadol_Lain_Entr_compl.pdf
- Rueda-Jaimes GE, Camacho-Lopez PA, Florez SM, Rangel AM. Validity and reliability of two silhouette scales to assess the body image in adolescent students. Rev Colomb Psiquiatr. 2012;41:101-10.
- Estévez R, Martínez L, Ávila JM, Beltrán B, Cuadrado C, Varela G. Comparación de prevalencias de obesidad y sobrepeso infantiles obtenidas según criterios nacional (Orbegozo) e internacional (IOTF). Nutr Hosp. 2010;25:484.
- Zapico AG, Blández J, Fernández E. Sobrepeso, obesidad y adecuación a la dieta mediterránea en adolescentes de la Comunidad de Madrid. Arch Med Deporte. 2010;27:271-80.
- Pérez L, Bayona I, Mingo T, Rubiales C. Utilidad de los programas de educación nutricional para prevenir la obesidad infantil a través de un estudio piloto en Soria. Nutr Hosp. 2011;26:1161-67.
- Hernández Camacho JD, Rodríguez Lazo M, Bolaños Ríos P, Ruiz Prieto I, Jáuregui-Lobera I. Hábitos alimentarios, sobrecarga ponderal y autopercepción del peso en el ámbito escolar. Nutr Hosp. 2015;32:1334-43.
- López E, Navarro M, Ojeda R, Brito E, Ruiz JA, Navarro M. Adecuación a la dieta mediterránea y actividad física en adolescentes de Canarias. Arch Med Deporte. 2013;30:208-14.
- Santaliestra-Pasías AM, Rey-López JP, Moreno Aznar. Obesity and sedentarism in children and adolescents: what should be done? Nutr Hosp. 2013;28:99-104.
- Chaput JP, Brunet M, Tremblay A. Relationship between short sleeping hours and childhood overweight/obesity: results from the "Québec en Forme" Project. Int J Obes (Lond). 2006;30:1080-5.
- Taheri S. The link between short sleep duration and obesity: we should recommend more sleep to prevent obesity. Arch Dis Child. 2006;91:881-4.
- Childhood obesity: causes. In: Parenting [online] [consulted on 15/11/2016]. Available in www.parenting.com/health-guide/childhood-obesity/causes
- Lindsay AC, Sussner KM, Kim J, Gortmaker S. The role of parents in preventing childhood obesity. Future Child. 2006;16:169-86.
- Magarey AM, Daniels LA, Boulton TJ, Cockington RA. Predicting obesity in early adulthood from childhood and parental obesity. Int J Obes Relat Metab Disord. 2003;27:505-13.