

Vol. 24 - Num. 95
Original Papers
Prevalence and sociodemographic factors associated with amblyopia in preschool children
Julia Torrecillas Peraltaa, David Prieto Merinob, Jerónimo Lajara Blesac, Jorge L. Alió Sanzd, Jorge L. Alió del Barriod
aPrograma de Doctorado en Ciencias de la Salud. Universidad Católica San Antonio. Murcia. España.
bMétodos Estadísticos Aplicados en Investigación Médica. Universidad Católica San Antonio. Murcia. España. Facultad de Epidemiología y Salud de la Población. London School of Hygiene and Tropical Medicine. Londres. Reino Unido .
cFacultad de Ciencias de la Salud. Universidad Católica San Antonio. Murcia. España.
dUnidad de Córnea, Catarata y Cirugía Refractiva. Vissum Miranza. Departamento de Oftalmología. Facultad de Medicina. Universidad Miguel Hernández. Alicante. España.
Correspondence: JL Alió. E-mail: jorge_alio@hotmail.com
Reference of this article: Torrecillas Peralta J, Prieto Merino D, Lajara Blesa J, Alió Sanz JL, Alió del Barrio JL. Prevalence and sociodemographic factors associated with amblyopia in preschool children . Rev Pediatr Aten Primaria. 2022;24:e291-e299.
Published in Internet: 20-09-2022 - Visits: 3854
Abstract
Objective: to estimate the prevalence of amblyopia and its treatment in preschool children in the province of Alicante over a long time period, and assess the influence of different sociodemographic factors.
Methods: cross-sectional descriptive observational study (2002-2015) using a validated amblyopia detection protocol (sensitivity, 89.3%; specificity, 93.1%) in preschool children aged 4 to 6 years. The primary outcome was the classification of the 140 102 examined children based on the test results ('normal', 'suspected amblyopia' or 'in treatment') and the explanatory variables: age, sex, school year, private/public ownership of school and school location.
Results: the prevalence of children with suspected amblyopia varied significantly between school years, ranging from 8.54% to 23.9% (p=0.00000). The prevalence of suspected amblyopia was significantly higher in children aged 6 years (16.68%; p=0.00000) and lowest in those attending private schools (8.05%; p=0.00000). The probability that a child with abnormal results was already in treatment increased with age (OR 2.06; p<0.001) and with enrolment in a private school (OR 1.56; p=0.001).
Conclusions: the prevalence of suspected amblyopia was high in the study area, with a higher risk in older children and children in the lowest socioeconomic status group. School-based screening programs for early detection of amblyopia are recommended to increase and equalize access to treatment, thereby reducing the prevalence and severity of amblyopia in children.
Keywords
● Amblyopia ● Primary care ● Visual acuity ● Visual impairmentINTRODUCTION
Amblyopia is defined as the reduction of best-corrected visual acuity (VA) of eyes with normal morphology.1,2 It occurs at early ages in childhood and results in abnormal development of the cortical visual pathway.1 The most common risk factors are strabismus and refractive errors.2
There are appropriate treatments for amblyopia, especially when it is not associated with a structural disorder and is detected early.1-3 It is considered the leading cause of monocular visual disability in children and young adults in Europe.3,4 Its prevalence ranges from 1% to 5% worldwide,5 and has been estimated at 7.5% in the specific case of Spanish children aged 3 to 6 years.6 The lack of consistency between studies may be due to differences in the characteristics of the study population, the VA criteria or the methodology employed.3 As far as we know, long-term studies on the prevalence of amblyopia in children had yet to be conducted in Spain.
The objective of this study was to estimate the prevalence of amblyopia and its treatment in preschool children in the province of Alicante through the implementation of school-based paediatric vision screening campaigns, and how they changed between 2002 and 2015, in addition to assessing the influence of various sociodemographic factors.
MATERIALS AND METHODS
Paediatric vision screening campaigns
We conducted a cross-sectional observational descriptive study at annual intervals to assess the impact of amblyopia in the preschool population in the province of Alicante (Spain) through vision screening campaigns carried out by the Fundación Jorge Alió. The tests were performed by a team of optometrists under the direction of ophthalmologists in 13 consecutive school years (2002-2015) and on children aged from 4 to 6 years enrolled in early childhood education centres in the province of Alicante in urban (population greater than 25 000, 74.2%), semi-urban (10 000 to 25 000, 8.2%) and rural areas (less than 10 000, 17.6%).
Based on the results obtained in the screening tests, the children were classified as “normal” cases (no impairment suggesting a visual abnormality), “suspected” and yet untreated amblyopia cases (VA was below the standard value for the child’s age7; an impairment was detected in ocular alignment or motility or the child did not pass the stereopsis test2) or “in treatment” (children with a previous diagnosis already receiving ophthalmological treatment).
The exclusion criteria were lack of express consent from the parents/guardians, absence from school on the day of testing and lack of cooperation with testing. In each annual screening campaign, children aged 4, 5 and 6 years newly admitted to participating schools were assessed, in addition to any children who had been classified as a suspected case in the previous year’s campaign.
This study adhered to the principles of the Declaration of Helsinki and followed all the applicable institutional and governmental regulations in relation to the ethical use of human volunteers in medical research.2
Vision screening
The following were performed: (a) VA test at a distance of 3 m with Lea symbols (house, apple, square and circle), in logarithmic progression of decreasing size from 0.1 to 2.08; (b) visual axis alignment study using the test of covering and uncovering the eye (cover test)9; (c) external eye examination with a torch, assessing the eyelids, corneal transparency, anterior chamber structures and pupillary glow (ruling out leukocoria)9,10 and (d) TNO random-dot stereogram test with red and green spectacles to measure stereopsis.9
The reliability of the tests used in the screening was validated by Casas-Llera et al.2 in a previously published study (sensitivity 89.3%, specificity 93.1%, positive predictive value 83.3%, negative predictive value 95.7%, positive likelihood ratio 12.86 and negative likelihood ratio 0.12).
Data processing
To better reflect the source population of the database, we cleansed the data by identifying the first visit for each child and excluding subsequent visits in “suspected” cases.
The primary outcome was the ophthalmological classification based on the screening results (“normal”, “suspected” and “in treatment”).
Starting from this classification, we established two binary (yes/no) outcome variables: (a) the abnormal results variable (grouping “suspected” and “in treatment” participants into a single “abnormal” category) and (b) the “in treatment” variable (which took the value “yes” in participants in treatment and “no” in untreated suspected cases, without assigning a value to participants with normal screening results, as they did not require treatment).
The explanatory variables were age (4, 5 or 6 years), sex, school year (2002 to 2015), location of school (rural, semi-urban or urban) and type of school (public, private with state subsidy, private).
Statistical analysis of the data
We summarised screening results by calculating the relative frequency of each category in each explanatory variable. We then compared these percentages by means of the χ2 test.
In the graphic analysis of time trends, we calculated the proportion of proportion of participants in each school year that corresponded to each possible screening result, in addition to the age distribution of participants.
We also fitted two multiple logistic regression models, one for each of the established binary outcome variables, to assess which of the explanatory variables under study could be associated to abnormal vision in the child or to already being in treatment at the time of enrolment in the study.
RESULTS
The study included a total of 140 102 children, tested and classified according to the screening results. Tables 1 and 2 present the distribution of the sample by school year, sex, age, location and type of school.
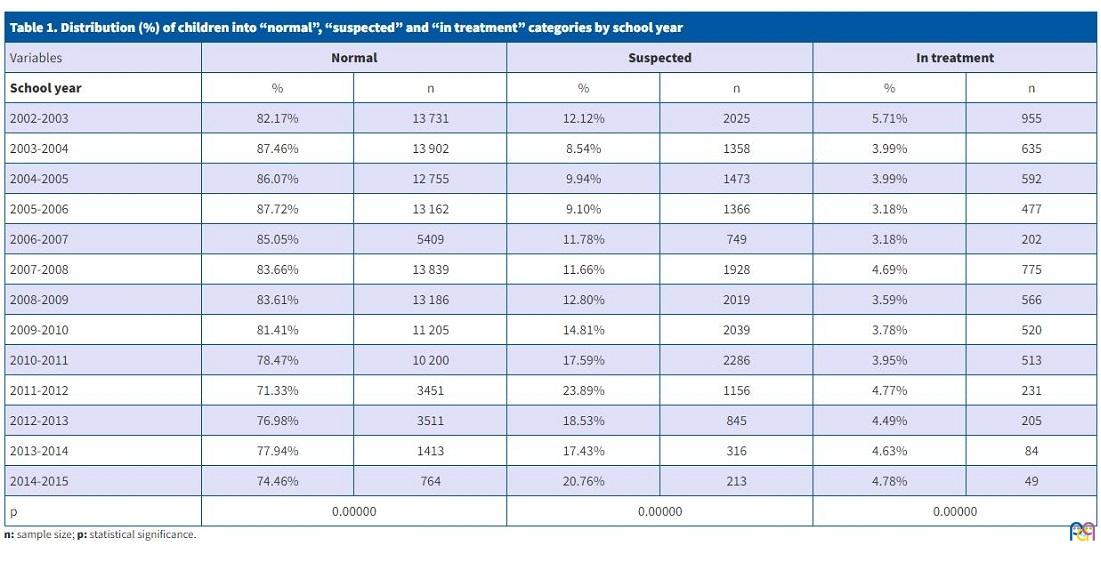
| Table 1. Distribution (%) of children into “normal”, “suspected” and “in treatment” categories by school year | ||||||
|---|---|---|---|---|---|---|
| Variables | Normal | Suspected | In treatment | |||
| School year | % | n | % | n | % | n |
| 2002-2003 | 82.17% | 13 731 | 12.12% | 2025 | 5.71% | 955 |
| 2003-2004 | 87.46% | 13 902 | 8.54% | 1358 | 3.99% | 635 |
| 2004-2005 | 86.07% | 12 755 | 9.94% | 1473 | 3.99% | 592 |
| 2005-2006 | 87.72% | 13 162 | 9.10% | 1366 | 3.18% | 477 |
| 2006-2007 | 85.05% | 5409 | 11.78% | 749 | 3.18% | 202 |
| 2007-2008 | 83.66% | 13 839 | 11.66% | 1928 | 4.69% | 775 |
| 2008-2009 | 83.61% | 13 186 | 12.80% | 2019 | 3.59% | 566 |
| 2009-2010 | 81.41% | 11 205 | 14.81% | 2039 | 3.78% | 520 |
| 2010-2011 | 78.47% | 10 200 | 17.59% | 2286 | 3.95% | 513 |
| 2011-2012 | 71.33% | 3451 | 23.89% | 1156 | 4.77% | 231 |
| 2012-2013 | 76.98% | 3511 | 18.53% | 845 | 4.49% | 205 |
| 2013-2014 | 77.94% | 1413 | 17.43% | 316 | 4.63% | 84 |
| 2014-2015 | 74.46% | 764 | 20.76% | 213 | 4.78% | 49 |
| p | 0.00000 | 0.00000 | 0.00000 | |||
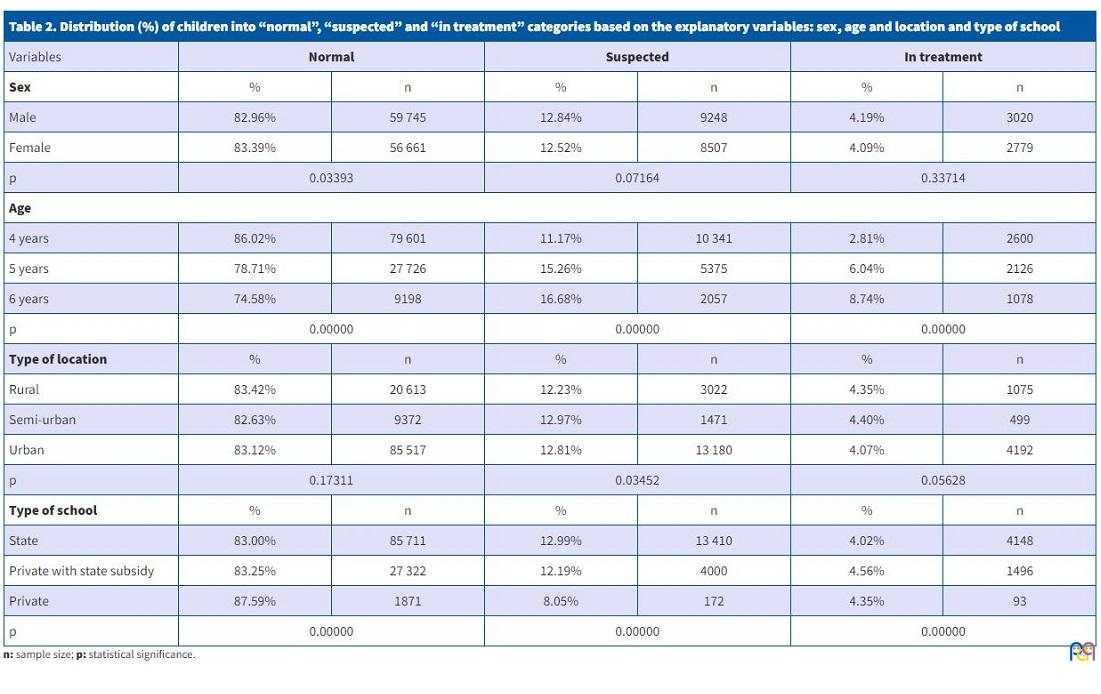
| Table 2. Distribution (%) of children into “normal”, “suspected” and “in treatment” categories based on the explanatory variables: sex, age and location and type of school | ||||||
|---|---|---|---|---|---|---|
| Variables | Normal | Suspected | In treatment | |||
| Sex | % | n | % | n | % | n |
| Male | 82.96% | 59 745 | 12.84% | 9248 | 4.19% | 3020 |
| Female | 83.39% | 56 661 | 12.52% | 8507 | 4.09% | 2779 |
| p | 0.03393 | 0.07164 | 0.33714 | |||
| Age | ||||||
| 4 years | 86.02% | 79 601 | 11.17% | 10 341 | 2.81% | 2600 |
| 5 years | 78.71% | 27 726 | 15.26% | 5375 | 6.04% | 2126 |
| 6 years | 74.58% | 9198 | 16.68% | 2057 | 8.74% | 1078 |
| p | 0.00000 | 0.00000 | 0.00000 | |||
| Type of location | % | n | % | n | % | n |
| Rural | 83.42% | 20 613 | 12.23% | 3022 | 4.35% | 1075 |
| Semi-urban | 82.63% | 9372 | 12.97% | 1471 | 4.40% | 499 |
| Urban | 83.12% | 85 517 | 12.81% | 13 180 | 4.07% | 4192 |
| p | 0.17311 | 0.03452 | 0.05628 | |||
| Type of school | % | n | % | n | % | n |
| State | 83.00% | 85 711 | 12.99% | 13 410 | 4.02% | 4148 |
| Private with state subsidy | 83.25% | 27 322 | 12.19% | 4000 | 4.56% | 1496 |
| Private | 87.59% | 1871 | 8.05% | 172 | 4.35% | 93 |
| p | 0.00000 | 0.00000 | 0.00000 | |||
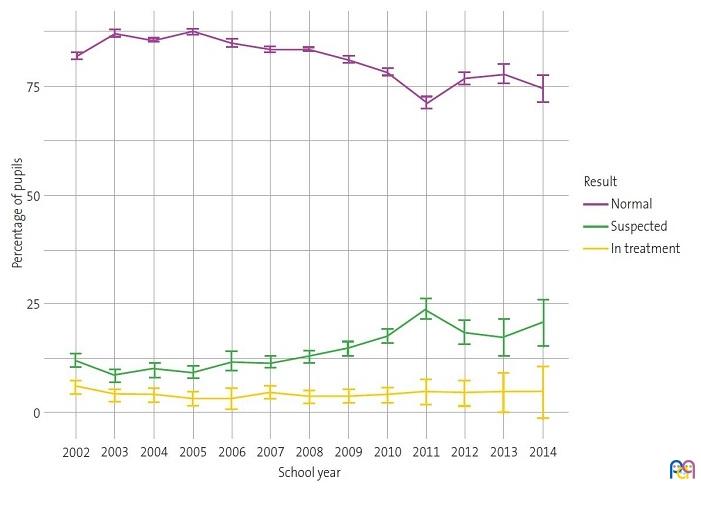
Over the course of the 13 annual screening campaigns, we observed substantial differences in the proportions of children categorised as “normal”, “suspected” or “in treatment” (Table 1). Thus, the prevalence of “suspected” cases ranged between 8.54% and 12.12% in the first six campaigns. However, from this proportion gradually increased from the 2008-2009 school year, peaking at 23.89% in the 2011-2012 school year. Similarly, we observed an increasing trend in the proportion of children “in treatment” from the 2008-2009 school year onwards (Table 1) (Fig. 1).
| Figure 1. Distribution of children as “normal”, “suspected” and “in treatment” by age: changes in test results over the school years. |
|---|
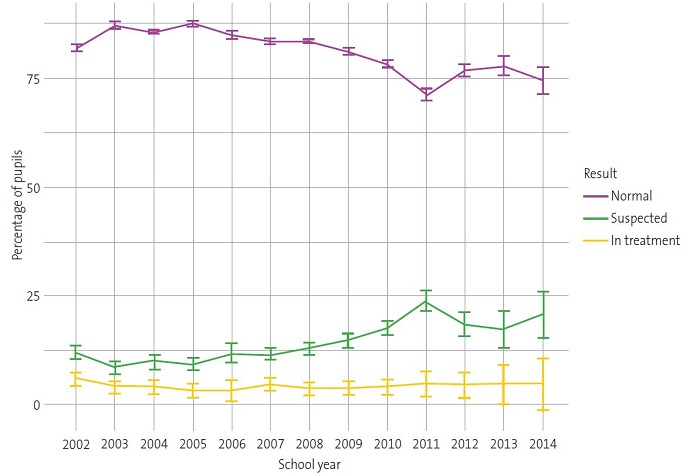 |
Suspected amblyopia was not associated with sex; the proportions were very similar in boys and girls (12.84% and 12.52%, respectively) (Table 2). It is worth highlighting that the proportion of suspected cases was notably higher in children aged 6 years compared to those aged 4 and 5 years (Table 2).
Moreover, we found a weak association between the setting of the school and the prevalence of suspected amblyopia. The prevalence was lower in rural areas (12.23%), and slightly higher in urban and semi-urban areas (12.81 and 12.97% respectively) (Table 2).
The type of school had a significant effect on the prevalence of suspected cases. It was lowest in private schools (8.05%). At the same time, the proportion of children in treatment was considerably lower in public schools (4.02%) (Table 2).
To identify the factors associated with abnormal test results and the probability of being in treatment, we conducted two logistic regression analyses, each corresponding to one of the dichotomous outcome variables: (a) comparison of children with normal and abnormal results (with the latter encompassing the “suspected” and “in treatment” categories) and (b) within the abnormal group, comparison of children in treatment and children not in treatment (Table 3).
| Table 3. Regression models. Model 1: factors associated with the classification as “abnormal”. Model 2: factors associated with a child with abnormal results being in treatment | ||||||
|---|---|---|---|---|---|---|
| Model 1 | Model 2 | |||||
| Variables | OR | CI | p | OR | CI | p |
| School year | ||||||
| School year | 1.05 | 1.05-1.06 | <0.001 | 0.92 | 0.91-0.93 | <0.001 |
| Sex | ||||||
| Boy | Reference | Reference | ||||
| Girl | 0.97 | 0.94-1.00 | 0.048 | 1.00 | 0.94-1.06 | 0.945 |
| Age | ||||||
| 4 years | Reference | Reference | ||||
| 5 years | 1.63 | 1.58-1.68 | <0.001 | 1.63 | 1.52-1.74 | <0.001 |
| 6 years | 2.07 | 1.98-2.17 | <0.001 | 2.06 | 1.88-2.25 | <0.001 |
| Type of location | ||||||
| Rural | Reference | Reference | ||||
| Semi-urban | 1.03 | 0.97-1.10 | 0.261 | 0.99 | 0.88-1.13 | 0.935 |
| Urban | 1.01 | 0.97-1.05 | 0.544 | 0.83 | 0.77-0.90 | <0.001 |
| Type of school | ||||||
| State | Reference | Reference | ||||
| Private with state subsidy | 1.00 | 0.97-1.03 | 0.972 | 1.30 | 1.21-1.40 | <0.001 |
| Private | 0.65 | 0.57-0.74 | <0.001 | 1.56 | 1.20-2.02 | 0.001 |
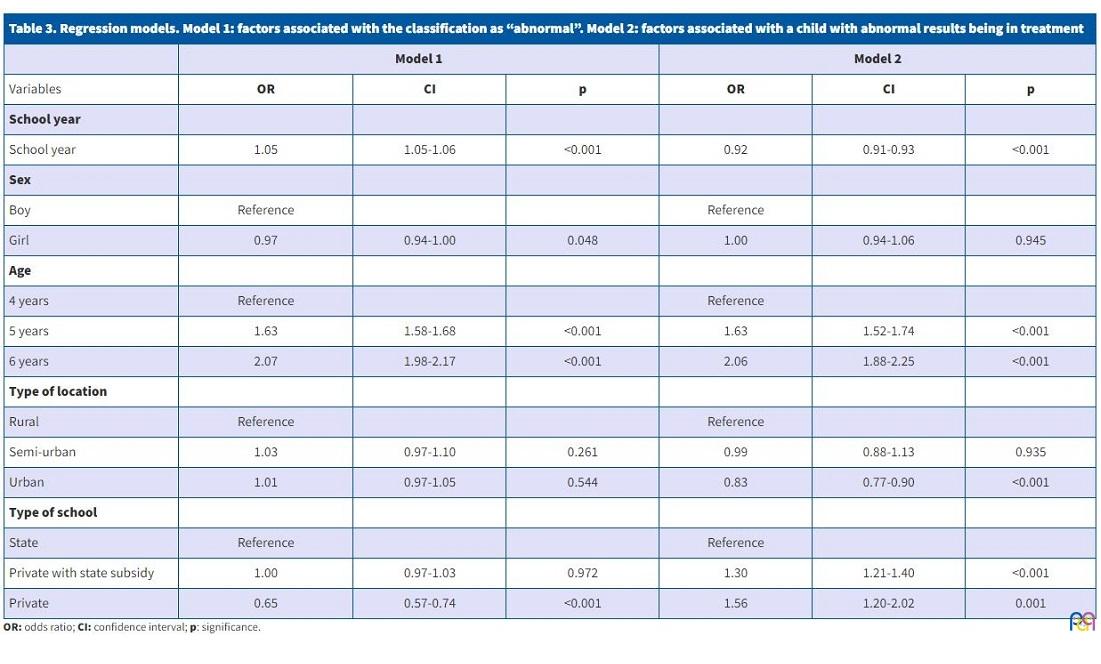
In Model 1 in Table 3, it can be seen that the odds of having an abnormal result increased by 5% each school year (p < 0.001). Similarly, the odds increased significantly with age; compared with age 4, the odds increased by 63% by age 5 years (OR 1.63; p < 0.001) and had doubled at 6 years (OR 2.07; p < 0.001). We also found slightly lower odds in girls (OR 0.97; p = 0.048). Lastly, the odds were significantly lower in private schools (OR 0.65; p < 0.001).
Among the factors that made it more likely for a child with abnormal results to be in treatment, we ought to highlight attendance to a private school (OR 1.56; p = 0.001) and older age. Compared with age 4, the odds increased by 63% at the age of 5 (p < 0.001) and doubled at 6 (p < 0.001) (Table 3, Model 2). Moreover, the probability of being in treatment was lower in schools in urban areas (OR 0.83; p < 0.001) and the probability that children newly included in the study would already be receiving treatment decreased each successive year during the study period, (OR 0.92; p < 0.001) (Table 3, Model 2).
The model for predicting who was in treatment was very accurate, with a mean error of 0.96% and a χ2 of 0.21 for the difference between expected and observed values (data not shown). The results obtained by placing the individuals into 10 groups (deciles) according to their expected risk did not differ much from what was actually observed (Table 4).
| Table 4. Calibration of the distribution of expected and observed cases into the probability gradient of a child with abnormal results being treated | |||||
|---|---|---|---|---|---|
| Decil | n | Expected mean risk | Observed mean risk | 95% CI | |
| Observed lower bound | Observed upper bound | ||||
| D1 | 2512 | 14.33% | 13.69% | 12.35% | 15.04% |
| D2 | 2484 | 17.04% | 17.59% | 16.10% | 19.09% |
| D3 | 2007 | 18.91% | 19.38% | 17.65% | 21.11% |
| D4 | 2468 | 20.89% | 19.49% | 17.93% | 21.05% |
| D5 | 2524 | 22,70% | 23,73% | 22,07% | 25,39% |
| D6 | 2155 | 24.66% | 23.53% | 21.74% | 25.32% |
| D7 | 2311 | 26.37% | 28.17% | 26.34% | 30.00% |
| D8 | 2291 | 29.12% | 28.68% | 26.83% | 30.53% |
| D9 | 2263 | 33.23% | 32.57% | 30.64% | 34.50% |
| D10 | 2304 | 40.24% | 40.58% | 38.58% | 42.59% |

DISCUSSION
The prevalence of suspected amblyopia among the 140 102 children from Alicante included in the study varied throughout the various paediatric ophthalmological campaigns, with a maximum of 23.9% and a minimum of 8.54% (Table 1). Both values are well above the international mean, established at 1% to 5%,5,11,12 although the lower values are more in line with those found in prevalence studies in other parts of Spain (7.5-9.8%).13,14
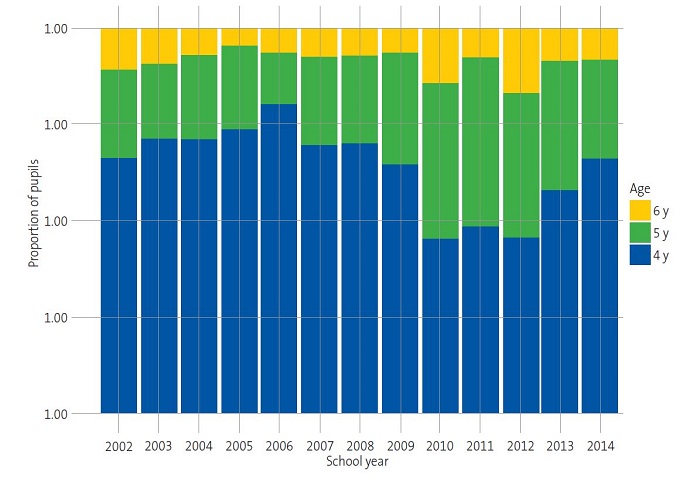
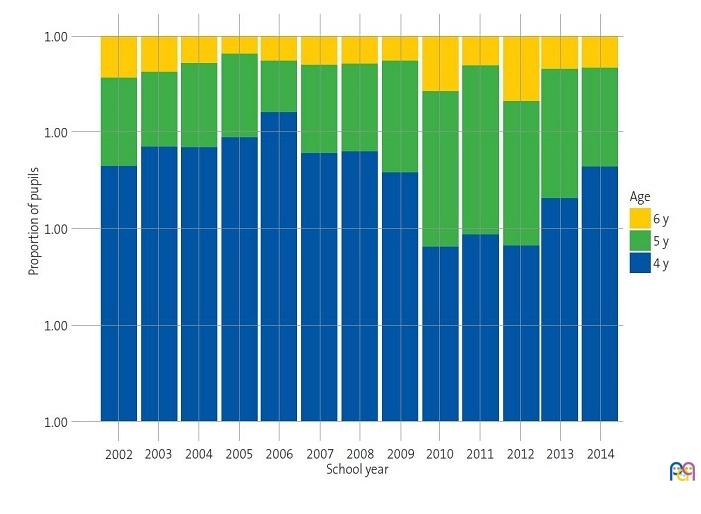
The high prevalence of suspected amblyopia from school year 2008-2009 onwards (12.80-23.89%) (Table 1) could be attributed to differences in the age distribution of the sample between the school years (Fig. 2). Given the association between suspected amblyopia and age (Table 2 and Fig. 1) and between suspected amblyopia and school year within the study period (Table 1 and Fig. 1), school years in which children were older had a higher proportion of suspected cases (Fig. 2). These results agree with those obtained by other authors on the importance of very early detection campaigns to achieve early treatment in children.15-19 On the other hand, the disparity in the results on the prevalence of amblyopia between published studies could be due to the lack of standardised criteria in relation to the most appropriate age for screening in the paediatric population, specific screening tests, diagnostic criteria or training of the staff performing the evaluations, among other factors.20-22
| Figure 2. Distribution of age groups by school year |
|---|
 |
Consistent with previous studies,23,24 we found no effect of sex on the prevalence of suspected amblyopia in the study population (Table 2), which could be explained by the uniformity of the sex distribution in in the sample (data not shown).
The current literature on the prevalence of amblyopia in children from rural communities is contradictory.25-27 We found a slightly lower prevalence in rural compared to semi-urban and urban areas25 (Table 2), despite the fact that the rural population usually has greater difficulties in gaining access to quality healthcare (public or private).28 This could be attributed to the fact that children in rural areas live in a much healthier environment that those in urban or semi-urban areas.
The results obtained after the data were dichotomised into “normal” and “abnormal” categories support the idea that children from private schools are more likely to have access to treatment for amblyopia than those from other schools (Table 3) for the socioeconomic reasons mentioned. The fact that the likelihood of access to treatment is higher in older children cannot be attributed to the effect of raising the awareness of parents through previous screening campaigns, as the data in the analysis came from children being screened for the first time. Perhaps the reason for the observed trend is that at older ages the symptoms of amblyopia become more obvious and children can be more cooperative.
The decreased probability of accessing treatment for amblyopia over the course of the study period and in urban areas is difficult to explain (Table 3), in the latter case chiefly on account of the accessibility of public and/or private healthcare. However, the very low prediction error of the model used suggests that factors such as a decrease in the early diagnosis of amblyopia in children and therefore in treatment initiation may be involved in these results.
The results of our study show that there is a high frequency of cases of suspected amblyopia in children in the province of Alicante, mainly in older children and children of low socioeconomic status. It is therefore reasonable for us to conclude by emphasising the great importance of programmes for the prevention and detection of amblyopia in early childhood, given that the effectiveness of treatment depends on making an early diagnosis, consequently equalising the chances of access to treatment for amblyopia. It is essential that international bodies standardise various criteria such as the optimal age to screen young children, the specific screening tests and diagnostic criteria to be applied and the required qualifications of staff performing the evaluations, in order to facilitate research on its prevalence.
CONFLICTS OF INTEREST
Jorge l. Alió is the president of the Foundation that bears his name. The other authors have no relevant commercial interests to declare with respect to this study.
Funding. The study was carried out and partly funded within the framework of the Red Temática de Investigación Cooperativa en Salud (RETICS: Thematic Networks for Cooperative Research in Health), reference number RD16/0008/0012.
ABBREVIATIONS
VA: visual acuity.
ACKNOWLEDGEMENTS
To the Fundación Jorge Alió for making the data from so many years of work available to us. To Dr Alejandro Galindo, of the University of Seville, for his help and the interest he has shown.
REFERENCES
- Braverman RS. Introduction to Amblyopia. In: American Academy of Ophthalmology [online] [accessed 1/02/2020]. Available at www.aao.org/disease-review/amblyopia-introduction
- Casas-Llera P, Ortega P, Rubio I, Santos V, Prieto MJ, Alió JL. Validation of a school-based amblyopia screening protocol in a kindergarten population. Eur J Ophthalmol. 2016;26:505-9.
- Rajavi Z, Sabbaghi H, Baghini AS, Yaseri M, Moein H, Akbarian, et al. Prevalence of amblyopia and refractive errors among primary school children. J Ophthalmic Vis Res. 2015;10:408-16.
- Wallace DK, Repka MX, Lee KA, Melia M, Christiansen SP, Morse CL, et al. Amblyopia Preferred Practice Pattern. Ophthalmology. 2018;125:105-42.
- Li YP, Zhou MW, Forster SH, Chen SY, Qi X, Zhang HM, et al. Prevalence of amblyopia among preschool children in central south China. Int J Ophthalmol. 2019;12:820-5.
- Martínez J, Cañamares S, Saornil MA, Almaraz A, Pastor JC. Prevalence of amblyogenic diseases in a preschool population sample of Valladolid, Spain. Strabismus. 1997;5:73-80.
- Merchante Alcántara M. Ambliopía y estrabismo. Pediatr Integral. 2018;XXII:32-44.
- Becker R, Hübsch S, Gräf MH, Kaufmann H. Examination of young children with Lea symbols. Br J Ophthalmol. 2002;86:513-6.
- Méndez Llatas M, Delgado Domínguez JJ. Oftalmología: exploración del niño estrábico; detección precoz. Detección precoz de los trastornos de refracción y ambliopía. Pediatr Aten Primaria. 2011;13:163-88.
- Parra B AJ. Tamización de ambliopía en cuidado primario. Universitas Médica. 2009;50:225-36 [online] [accessed 23/08/2022]. Available at www.redalyc.org/articulo.oa?id=231018809008
- Thompson JR, Woodruff G, Hiscox FA, Strong N, Minshull C. The incidence and prevalence of amblyopia detected in childhood. Public Health. 1991;105:455-62.
- Hartmann EE, Dobson V, Hainline l, Marsh-Tootle W, Quinn GE, Ruttum MS, et al. Preschool vision screening: summary of a task force report. Ophthalmology. 2001;108:479-86
- Gil de Gómez G. Detección de anomalías oculares. Acta Estrabológica. 1986;14:51-61.
- Fernández-Valles MC. Estudio epidemiológico de la ambliopía en la población infantil de nuestra área hospitalaria [doctoral dissertation]. Universidad de Sevilla. 2003. 214 pp.
- Jensen H, Goldschmidt E. Visual acuity in Danish school children. Acta Ophthalmol (Copenh). 1986;64:187-91.
- Eibschitz-Tsimhoni M, Friedman T, Naor J, Eibschitz N, Friedman Z. Early screening for amblyogenic risk factors lowers the prevalence and severity of amblyopia. J AAPOS. 2000;4:194-9.
- Al-Tamimi E, Shakeel A, Yassin SA, Ali SI, Khan UA. A clinic-based study of refractive errors, strabismus, and amblyopia in pediatric age-group. J Family Community Med. 2015;22:158-62.
- Ehrlich MI, Reinecke RD, Simons K. Preschool vision screening for amblyopia and strabismus. Programs, methods, guidelines, 1983. Surv Ophthalmol. 1983:28:145-63.
- Mocanu V, Horhat R. Prevalence and Risk Factors of Amblyopia among Refractive Errors in an Eastern European Population. Medicina (Kaunas). 2018;54:1-11.
- Martín Martín R, Bilbao Sustacha JA, Collado Cuco A. Cribado visual en atención primaria, ¿cómo se realiza? Rev Pediatr Aten primaria. 2013;15:221-7.
- Powell C, Porooshani H, Bohorquez MC. Screening for amblyopia in childhood. Cochrane Database Syst Rev. 2005:CD005020.
- Kemper AR, Margolis PA, Downs SM, Bordley WC. A Systematic Review of Vision Screening Tests for the Detection of Amblyopia. Pediatrics. 1999;104;1220-2.
- Yekta A, Hashemi H, Azizi E, Rezvan F, Ostadimoghaddam H, Derakhshan A, et al. The prevalence of amblyopia and strabismus among schoolchildren in Northeastern Iran, 2011. Iran J Ophthalmol. 2012;24:3-10.
- Rezvan F, Khabazkhoob M, Fotouhi A, Hashemi H, Ostadimoghaddam H, Heravian J, et al. Prevalence of refractive errors among school children in Northeastern Iran. Ophthalmic Physiol Opt. 2012;32:25-30.
- Padhye AS, Khandekar R, Dharmadhikari S, Dole K, Gogate P, Deshpande M. Prevalence of uncorrected refractive error and other eye problems among urban and rural school children. Middle East Afr J Ophthalmol. 2009;16:69-74.
- Verma R, Rathi M, Dhull CS, Sachdeva S, Phogat J. Prevalence and causes of low vision among urban and rural school children. Int J Community Med Public Health. 2018;5:5310-5.
- Lu W, Yu X, Zhao l, Zhang Y, Zhao F, Wang Y et al. Enhanced Gray Matter Volume Compensates for Decreased Brain Activity in the Ocular Motor Area in Children with Anisometropic Amblyopia. Neural Plast. 2020;2020(ID8060869):1-7.
- Sharma A, Wong AM, Colpa l, Jin YP. Socioeconomic status and utilization of amblyopia services at a tertiary pediatric hospital in Canada. Can J Ophthalmol. 2016;51:452-8.
Comments
This article has no comments yet.