


Prevalence of metabolic syndrome in children of Comodoro Rivadavia
Andrés Quezadaa, J Garcíaa, M A Rodrígueza, G M Poncea
aUniversidad Nacional de la Patagonia San Juan Bosco. Facultad de Ciencias Naturales. Centro Regional de Investigación y Desarrollo Científico-Tecnológico (CRIDECIT). Comodoro Rivadavia. Argentina.
Correspondence: A Quezada. E-mail: andresquezada3@yahoo.com.ar
Reference of this article: Quezada A, García J, Rodríguez MA, Ponce GM. Prevalence of metabolic syndrome in children of Comodoro Rivadavia. Rev Pediatr Aten Primaria. 2019;21:e179-e191.
Published in Internet: 31-10-2019 - Visits: 8796
Abstract
Introduction: health is essential for social growth. In recent years, there has been an emphasis on primary prevention. In this context, metabolic syndrome (MS) is a relevant issue, given its potential impact on cardiovascular, circulatory and metabolic health. Childhood is the most appropriate time for intervention, as corrective measures and strategies can be implemented in this period. Objective: the aim of our study was to establish the prevalence of MS in the children of Comodoro Rivadavia (Argentina) to contribute information that may be useful in the development of preventive strategies.
Material and methods: the study included 317 children (174 girls and 143 boys) aged 6 to 11 years that regularly attended neighbourhood centres and the 3 schools of Comodoro Rivadavia. Having obtained parental informed consent, we measured their weight, height, waist circumference collected and blood pressure and obtained a blood sample to measure serum levels of triglycerides, HDL cholesterol and glucose.
Results: applying the Adult Treatment Panel III (ATP III) criteria modified by Cook, we found a prevalence of MS of 3.50% in boys and 3.40% in girls, without a statistically significant difference between the sexes. We found waist circumference values above normal, elevation of triglycerides in blood, raised blood pressure and low levels of HDL cholesterol.
Conclusions: these preliminary results highlight the need of performing more thorough investigations for the early detection of MB in the paediatric age group with the aim of preventing the development of chronic diseases in the future.
Keywords
● Metabolic syndromeINTRODUCTION
Mankind has experienced significant changes with a direct impact on lifestyle, so the health-disease dynamic equilibrium that was known until recently has been shifting slowly and progressively toward an imbalance where new disease states are increasingly frequent, which poses a significant challenge from an epidemiological standpoint. This is why epidemiology as a science has become very important in medical clinical practice, as studies in this field have allowed not only the description of new health problems but also the identification of their aetiological components.1 Metabolic syndrome (MS), an emergent disease in epidemiology, has been studied extensively in recent decades due to its repercussions in human health, mainly adults. It can be defined as a constellation of risk factors or metabolic abnormalities in an individual that are strongly associated with outcomes such as cardiovascular disease or diabetes mellitus type 2.2 The prevalence of MS is alarming due to its sustained increase over time, with little hope for the near future.
When it comes to paediatric populations, there is a higher risk that these events develop at earlier ages, so it is essential that MS is identified in a timely manner, as in this stage of life, corrective measures can still be implemented to prevent irreversible consequences. 3 Metabolic syndrome is characterised by the accumulation of body fat in the abdominal region, giving rise to an excess of visceral fat4 that not only results in overweight or obesity but may cause a collection of characteristic metabolic abnormalities. Chief among these abnormalities are elevation of serum insulin, glucose intolerance, dyslipidaemia due to serum elevation of triglycerides and low-density lipoprotein (LDL) cholesterol accompanied by a decrease in high-density lipoprotein (HDL) cholesterol levels and high blood pressure,5 hyperuricemia, haemorrhagic complications and fibrinolysis, as well as a pro-inflammatory state that can be identified through the elevation of C-reactive protein (CRP) serum levels.6
Some authors have proposed that MS starts developing in childhood.7 This is why criteria have been established for children that, while heterogeneous, may be useful in paediatric clinical practice to establish risk. Some of the most widely used criteria include the modified Adult Treatment Panel III (ATP III) criteria, 8 the growth reference of the World Health Organization (WHO)9 and the International Diabetes Federation (IDF) consensus definition of MS.10 Some of the studies referenced most widely in epidemiological studies that have contributed data for adapting adult ATP III values to the paediatric population are those by Cook,11 Ferranti12 and Weiss.13
MATERIALS AND METHODS
We conducted a cross-sectional descriptive study. The target population comprised all children aged 6 to 11 years residing in Comodoro Rivadavia. The accessible population was all children enrolled in the three public primary schools or assigned to the primary care centres in the Municipality of Comodoro Rivadavia (Argentina) during the comprehended in the 2009-2011 period. Participation was voluntary and we applied the following sample selection criteria:
- Inclusion criteria: children aged 6 to 11 ±5 years; written informed consent given by parents, assent of children.
- Exclusion criteria: hospitalization the year prior to the study; acute disease at the time of the study; history of chronic, renal, hepatic or thyroid disease; treatment with drugs that can affect energy or lipid metabolism in the 6 months prior to the study.
We recruited participants by consecutive sampling, including children that met the aforementioned criteria. We applied the following formula to calculate the sample size (N):
N = (Z / A)2 / p (1-p),
where Z is the coefficient, representing a 95% level of confidence with a value of 1.96; A represented the desired precision with a value of 0.02, and p the expected prevalence of MS, whose value was 3%, based on the previous work of Pedrozo et al.14 Thus, we estimated that we needed a sample of 279 children. Given the possibility of problems in the collection of complete data for every participant, we considered including additional participants, so the final sample included 317 voluntary participants, including 174 girls (54.9%) and 143 boys (45.1%).
We defined MS applying the ATP III criteria modified by Cook11 for the paediatric population.
To categorise participants based on the body mass index (BMI), we applied the growth reference of the WHO (BMI z-score, or BMIz).9 We applied the following cut-off points: obesity, BMIz ≥ 2; overweight, BMIz ≥ 1 and < 2; normal weight, BMIz < 1 and ≥ -1.
To define abdominal obesity, we used the waist circumference (WC), measured with a non-retractable tape measure. The waist was measured at the midway between the lowest rib and the iliac crest, and we applied the cut-off points proposed by the in the percentile tables of the Centers for Disease Control and Prevention (CDC)15: overweight/obesity, at or below 90th percentile (90P); normal weight, below 90P.
Blood chemistry tests
A venous blood sample was obtained after a fast of at least 12 hours for blood chemistry tests. The sample was split into 2 collection tubes, one with sodium fluoride as an anticoagulant for subsequent serum separation and measurement of blood glucose (bG), and a dry tube for measurement of HDL cholesterol and triglyceride (TG) levels.
- Blood glucose: measured using the enzymatic glucose oxidase-peroxidase method.16 HDL cholesterol: measured using the direct HDL method after serum separation and selective precipitation of low-density lipoprotein (LDL) and very low-density lipoprotein (VLDL) with the addition of phosphotungstic acid in the presence of magnesium ions. The HDL that remained in the supernatant was measured with the enzymatic cholesterol oxidase-peroxidase method.17
- TG: measured by the enzymatic glycerol phosphate oxidase-peroxidase method.18 To rule out renal and hepatic disease, we also measured levels of creatinine and thyroid-stimulating hormone and performed liver function panels.
All determinations were performed with a Wiener Lab Metrolab 2300 PLUS random access clinical chemistry analyser. We assessed the accuracy and precision of biochemical determinations using a commercially available control, Standatrol S-E nivel 3 (lyophilised human serum; Wiener Laboratorios SAIC), that was processed together with the samples.
Measurement of blood pressure (BP)
We measured blood pressure with an Omron HEM-431 manual blood pressure monitor validated for the purpose by the European Society of Hypertension.19 Before the measurement, the child was seated with the back resting on the backrest of the chair, legs uncrossed and the bared right arm relaxed and resting at the level of the heart. We placed the lower edge of the cuff 2 cm above the elbow crease. We asked the child to remain silent while the cuff was inflated and deflated. We started by taking three different measurements of BP, at least 1 minute apart. If the child had not been sitting previously in the waiting room, an interval of 5 minutes was allowed to pass before the first measurement. Of the three measurements, we averaged the second and the third to calculate the mean arterial pressure (MAP). This was the value that we used to determine whether the child had normal or raised blood pressure at the time of the appointment. If we found a difference of more than 10 mmHg between the 2 last systolic pressures or of more than 5 mmHg between the 2 last diastolic pressures, additional BP measurements were taken, in which case the last 2 measurements were used to calculate the MAP. We used the cut-off points established in the ATP III, using the percentile tables of the WHO as reference.9
Identification of MS
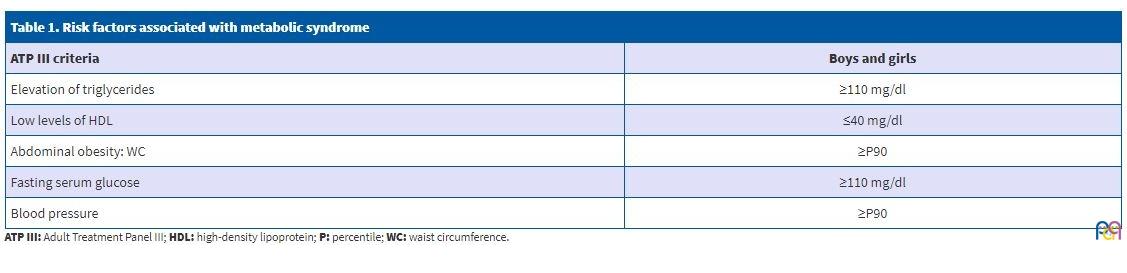
We defined MS according to the ATP III criteria modified by Cook for the paediatric population,11 that is, as the coexistence of 3 or more of the risk factors presented in Table 1.
| Table 1. Risk factors associated with metabolic syndrome | |
|---|---|
| ATP III criteria | Boys and girls |
| Elevation of triglycerides | ≥110 mg/dl |
| Low levels of HDL | ≤40 mg/dl |
| Abdominal obesity: WC | ≥P90 |
| Fasting serum glucose | ≥110 mg/dl |
| Blood pressure | ≥P90 |
Non-relevant variables
We collected data on the following variables through a validated semi-structured interview:
- Physical activity. We asked about the physical activity of participating children outside school hours. We established the overall level of physical activity for the past 7 days, for which purpose we used the short form of the International Physical Activity Questionnaire (IPAQ).20 The short form of the IPAQ allows the categorization of physical activities by intensity and, based on the results, the classification of respondents as inactive, irregularly active and regularly active as follows:
- Inactive: individuals that have not walked or performed any other form of moderate or vigorous physical activity in the past 7 days in bouts of at least 10 minutes. All children that did not perform any physical activity fall into this category.
- Regularly active: individuals that walked or engaged in other form of moderate to vigorous physical activity for a cumulative duration per day of at least 30 minutes in bouts of at least 10 minutes with a minimum level of exertion, 5 or more days in the past 7 days, or that engaged in vigorous physical activity in bouts of at least 20 minutes straight at least 3 days in the past 7 days. This category included children who engaged in physical activity outside of school.
- Irregularly active: individuals that walked or engaged in other form of moderate to vigorous physical activity for a cumulative duration per day of at least 10 minutes, but that did not meet all the required criteria to be considered regularly active. All children who only engaged in the physical activities that were part of the school programming were in this category.
- Hours of screen time: we asked about the average number of minutes/horas spent on activities such as watching television, playing computer games or using similar devices in the past 7 days. We established a cut-off point of 2 hours a day as sufficient recreational screen time, as proposed by the American Academy of Pediatrics21,22 and several other scientific sources.23,24
Descriptive statistical analysis
We have expressed the results of the descriptive analysis in terms of the median, first quartile (Q1) and third quartile (Q1), as the distributions of the variables under study were not normal.25
Inferential statistical analysis
To assess for differences between the sexes (boys and girls) in clinical and laboratory variables, we used the t test or the Mann-Whitney U test depending on the distribution of the continuous data. We performed univariate analyses to evaluate the association between study variables and the presence of overweight or obesity. We compared continuous variables by means of the Spearman rank-order correlation coefficient and categorical variables with the χ2 test. We set the threshold for statistical significance at 0.05. We performed the statistical analyses with the software Stata 11.0 (Stata Corp LP; College Station, Texas, USA).25
The study was approved by the Ethics Committee of the local public hospital and adhered to the international principles of the Declaration of Helsinki.
RESULTS
Anthropometric and metabolic characteristics and blood pressure
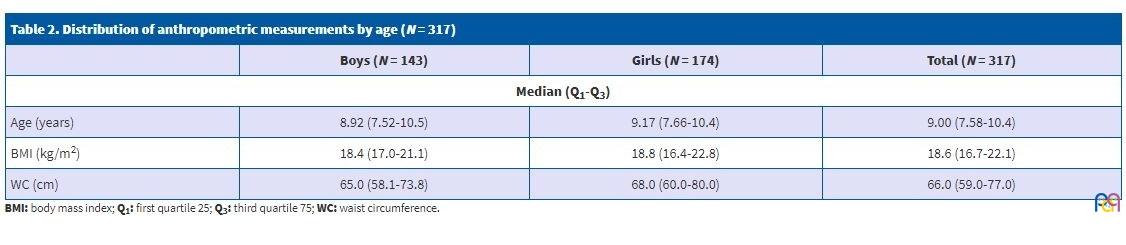
Table 2 presents the characteristics of the paediatric sample under study by sex.
| Table 2. Distribution of anthropometric measurements by age (N = 317) | |||
|---|---|---|---|
| Boys (N = 143) | Girls (N = 174) | Total (N = 317) | |
| Median (Q1-Q3) | |||
| Age (years) | 8.92 (7.52-10.5) | 9.17 (7.66-10.4) | 9.00 (7.58-10.4) |
| BMI (kg/m2) | 18.4 (17.0-21.1) | 18.8 (16.4-22.8) | 18.6 (16.7-22.1) |
| WC (cm) | 65.0 (58.1-73.8) | 68.0 (60.0-80.0) | 66.0 (59.0-77.0) |
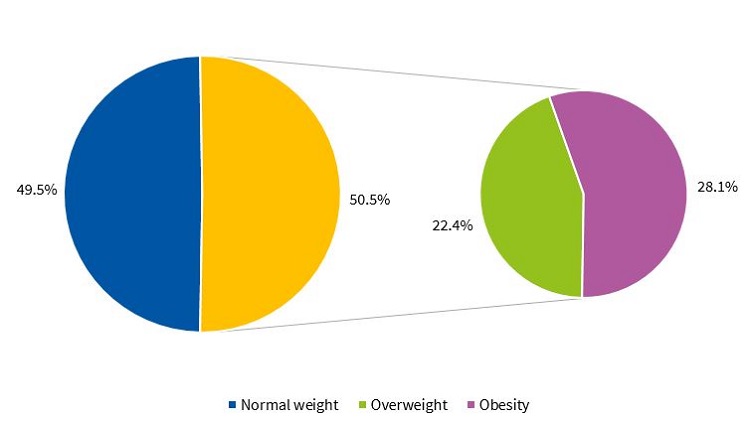
Figures 1 and 2 present the percent distribution of the BMI by sex, applying the standards of the WHO.9
| Figure 1. Percent distribution of BMI z-scores in boys based on the WHO criteria (N = 143) |
|---|
 |
| Figure 2. Percent distribution of BMI z-scores in girls based on the WHO criteria (N = 174) |
|---|
 |

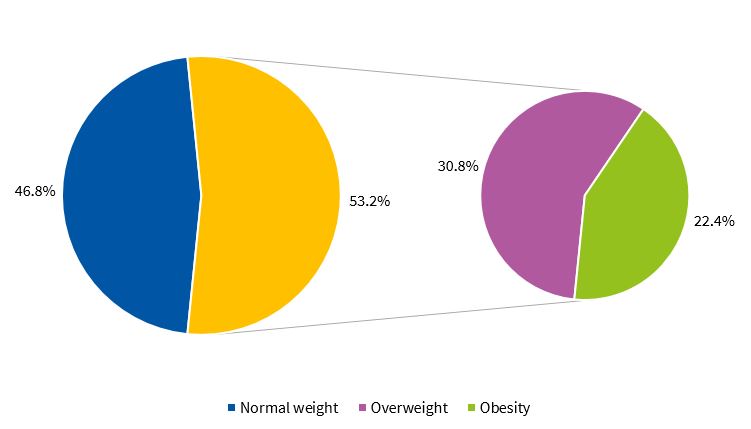
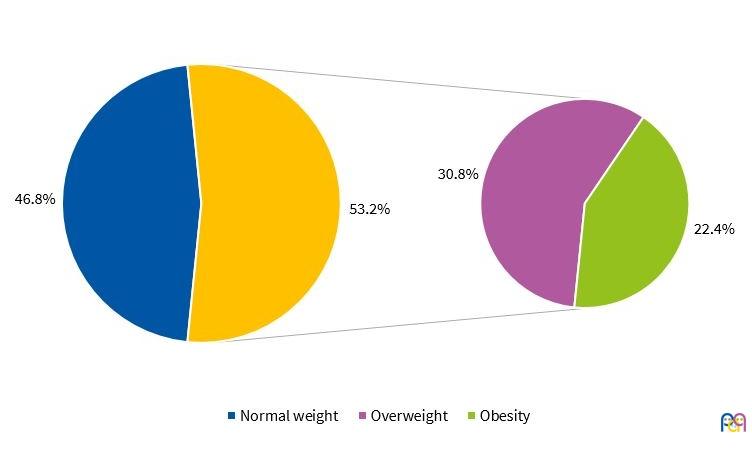
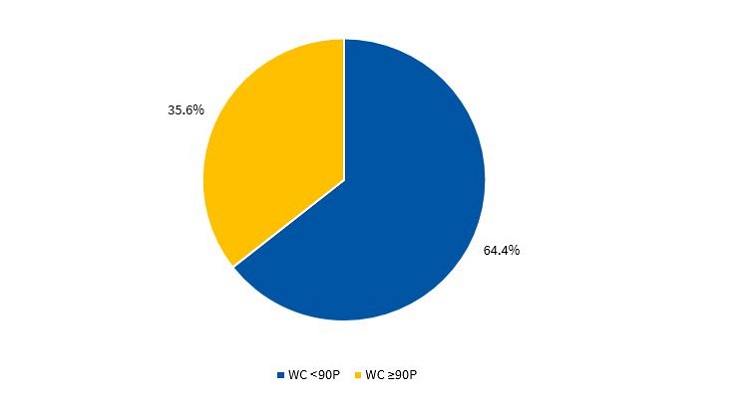
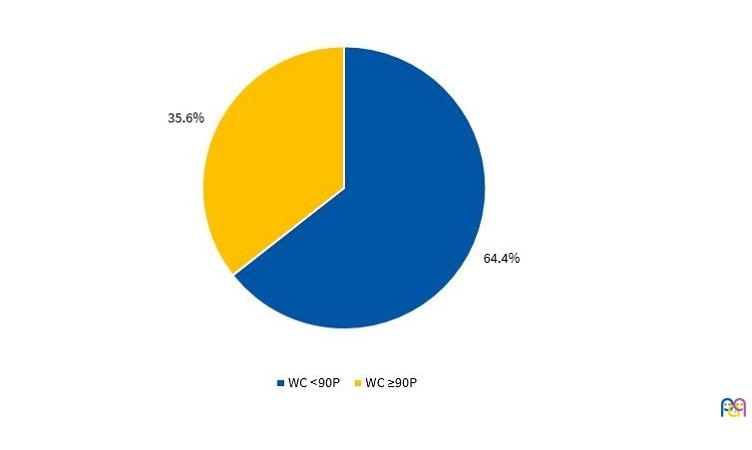
Figures 3 and 4 present the percentile distribution of the WC applying the criteria of the CDC15 in male and female participants.
| Figure 3. Percent distribution of waist circumference in boys applying the CDC criteria (N = 143) |
|---|
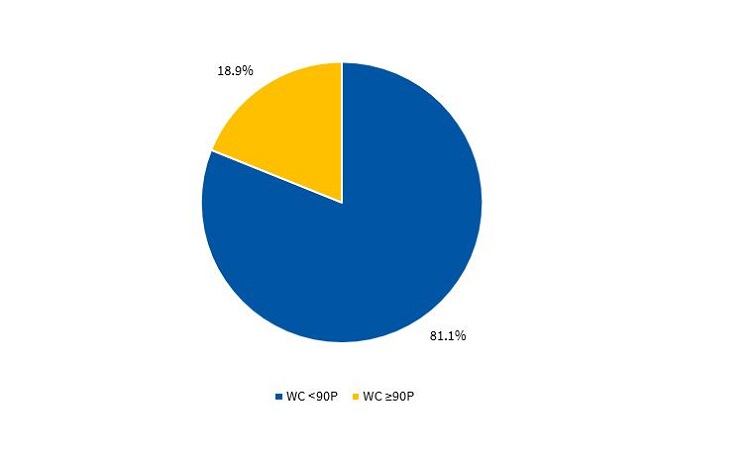 |
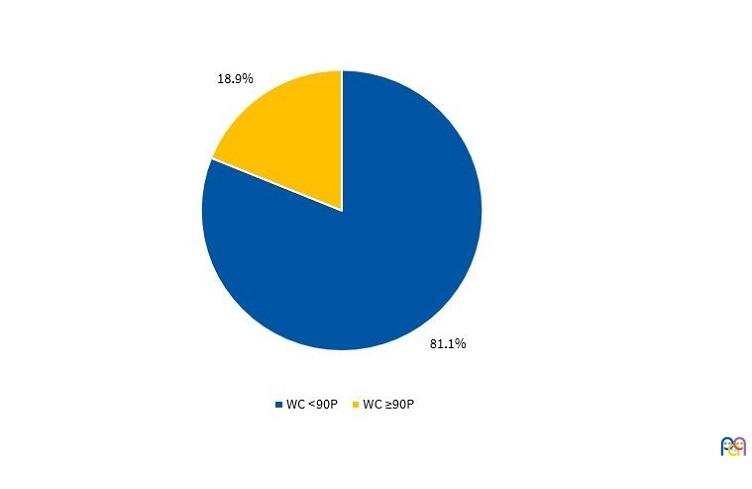
| Figure 4. Percent distribution of waist circumference in girls applying the CDC criteria (N = 174) |
|---|
 |
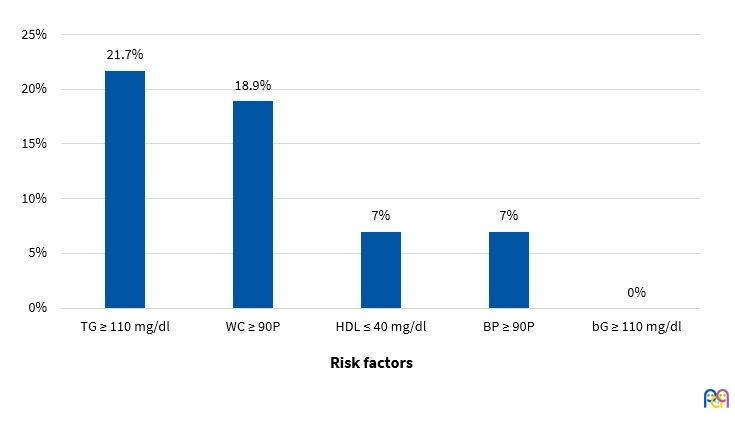
Risk factors for metabolic syndrome
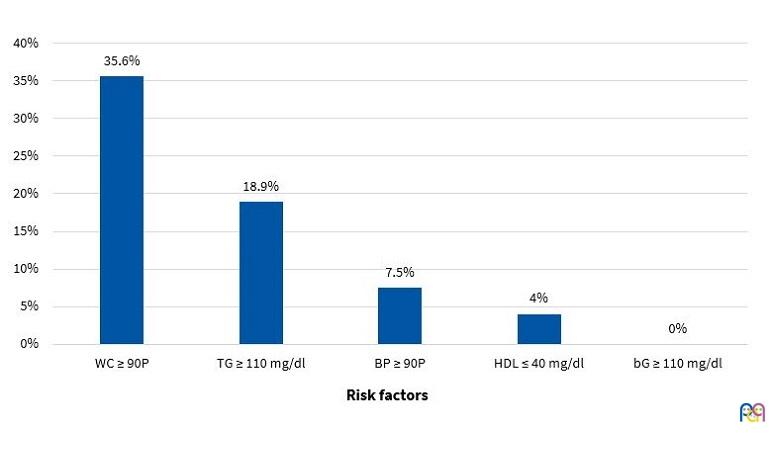
Figures 5 and 6 present the frequency of the risk factors that constitute MS (modified ATP III criteria11) in boys and girls, respectively.
| Figure 5. Frequency of presence of risk factors for metabolic syndrome in boys (N = 143) |
|---|
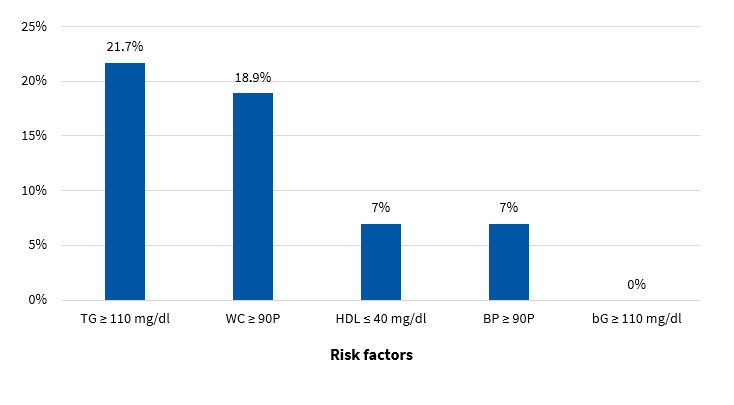 |
| Figure 6. Frequency of presence of risk factors for metabolic syndrome in girls (N = 174) |
|---|
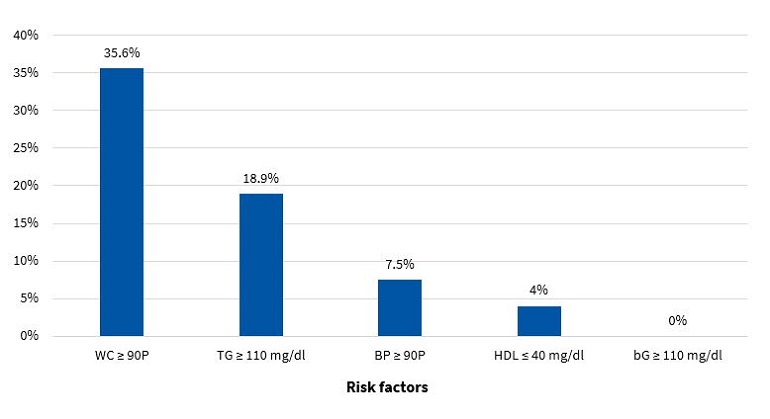 |
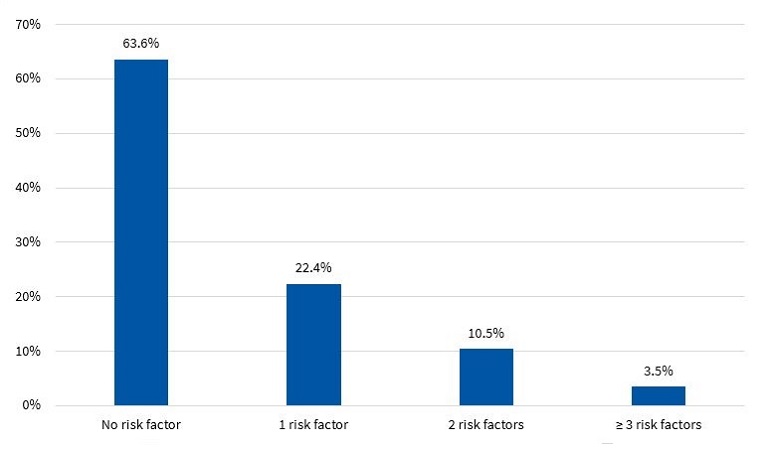
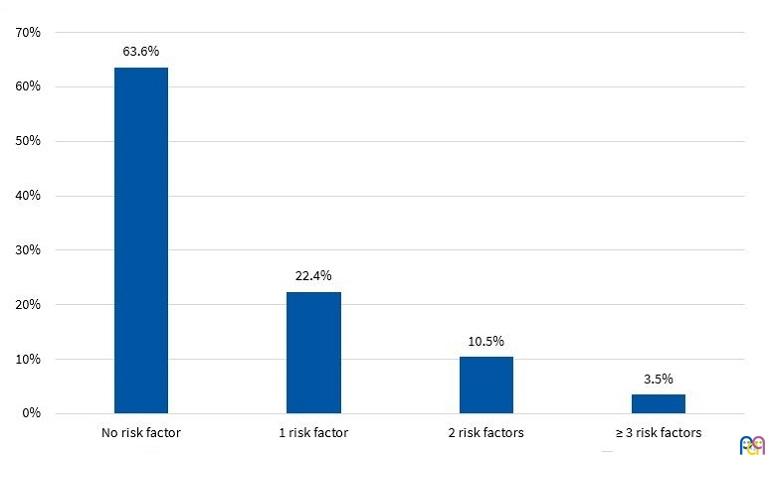
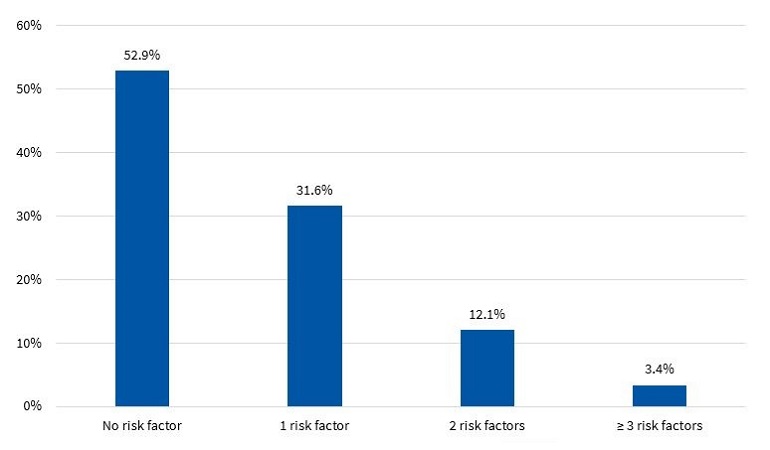
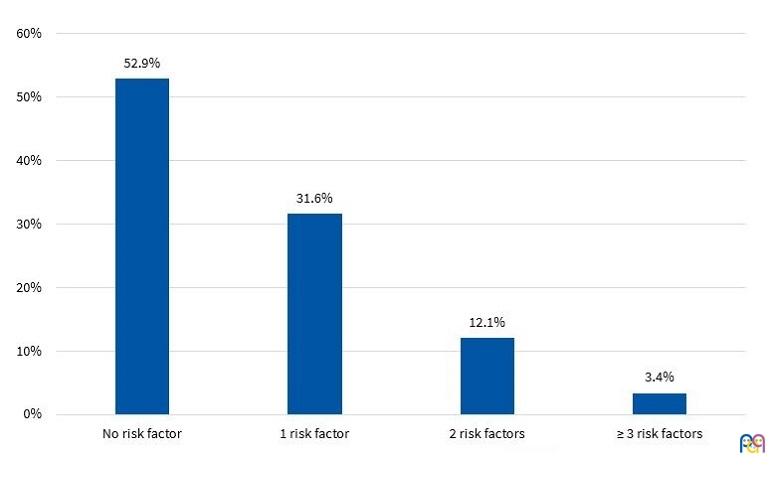
Figures 7 and 8 present the percent distribution of the number of risk factors present in boys and girls, respectively.
| Figure 7. Percent distribution of risk factors in boys (N = 143) |
|---|
 |
| Figure 8. Percent distribution of risk factors in girls (N = 174) |
|---|
 |
Prevalence of metabolic syndrome
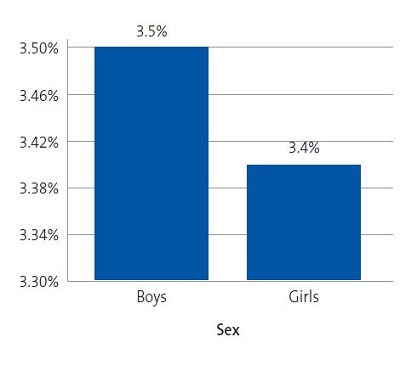
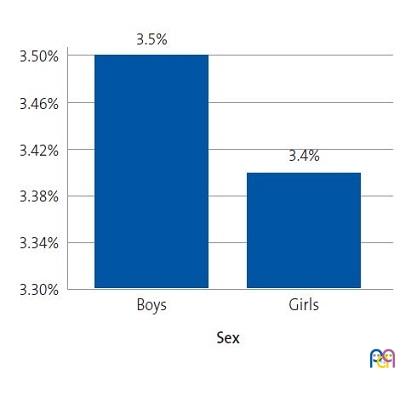
Figure 9 shows the prevalence of MS by sex in the sample under study.
| Figure 9. Prevalence of metabolic syndrome based on the ATP III criteria modified by Cook11 (N = 317) |
|---|
 |
Environmental factors
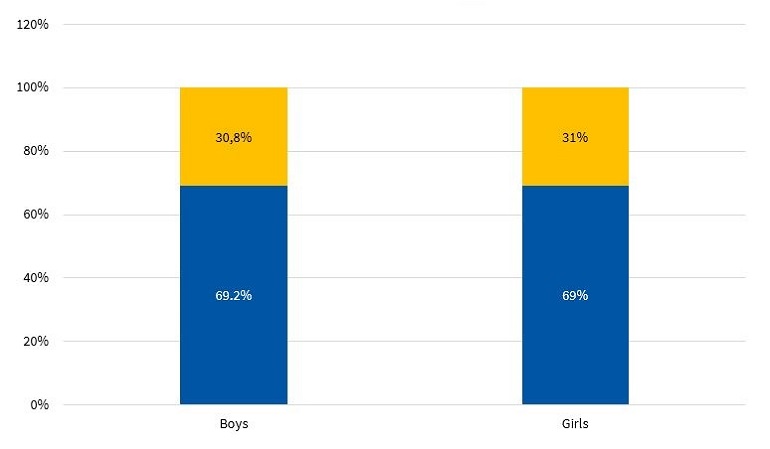
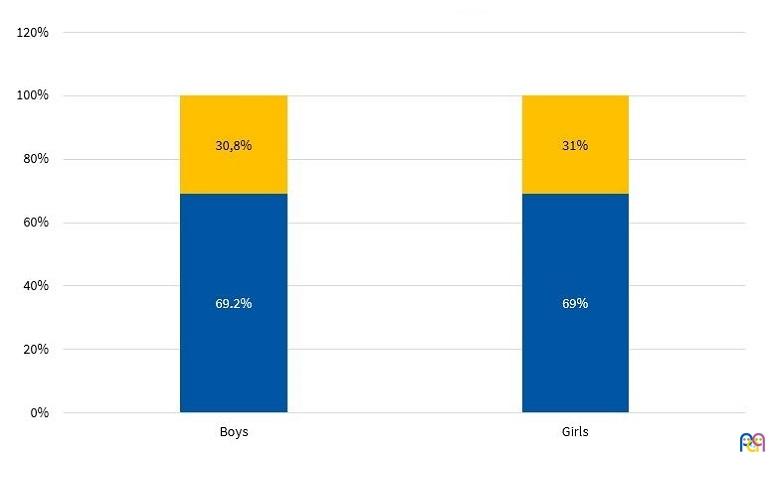
In addition, Figure 10 presents the percent distribution by sex of physical activity categories defined based on the IPAQ.20
| Figure 10. Percent distribution of type of weekly physical activity by sex (N = 317) |
|---|
 |
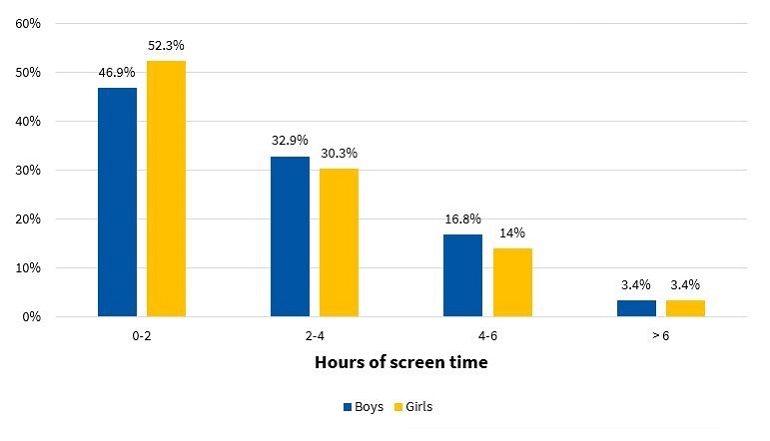
Lastly, Figure 11 presents the distribution of total hours a day of screen time (television, video games, smart phones, etc) for each sex.
| Figure 11. Percent distribution of hours of screen time per day, including television, computer or video games, by sex (N = 317) |
|---|
 |

DISCUSSION
The diagnosis of MS in adulthood is challenging, as there is no consensus between international organizations as to the criteria used to define it.26 In the paediatric age group, there is the additional complication of the cut-off points used for diagnosis both in research and clinical practice, as the ones currently used are generally adapted from values used in adults. Some of the references consulted most frequently on the subject are the ATP III and the IDF criteria. When it comes to the former, Cook11, Ferranti12 and Weiss13 are the authors that have unquestionably contributed the most data on the paediatric population. These three researchers agree that, as is the case in adults, the diagnosis of MS requires the presence of at least 3 risk factors in the individual. However, they diverge in the proposed cut-off points and the indicators used. There is variability in the prevalence found in different studies due to the heterogeneity of the criteria used in the definition of MS. Studies using the approach proposed by Ferranti have found higher prevalence values compared to studies using the criteria proposed by Cook or Weiss. This is mainly due to the Ferranti criteria being much more stringent. 26 Due to the differences found in paediatric studies, we decided to use the values proposed by Cook, which have been widely used in epidemiological research. We found a prevalence of MS of 3.50% in boys and 3.40% in girls, with no significant differences between the sexes (Figure 9). This was consistent with the findings of a study conducted in Posadas, Misiones, in a sample of children aged 11 to 14 years, in which the prevalence was 2.50%. It was also similar to the findings of a study conducted in Venezuelan children of similar characteristics (3.70%),27 where every child in the sample had at least 1 risk factor, a circumstance that did not occur in our sample of children from Comodoro Rivadavia, where 63.6% of boys and 52.9% of girls did not have any risk factors (Figures 7 and 8). Other studies have reported a prevalence of 5.1% (Medellin, Colombia)28 or 2.2% (Merida, Venezuela).29
When we compared children with and without MS, we found statistically significant differences in the presence of 4 out of the 5 risk factors under consideration. When it came to WC, as expected, we found a higher median in children with MS (p < 0.01). An increased WC is an indicator of increased visceral fat, which promotes the release of free fatty acids and in turn the activation of mechanisms that promote atherosclerosis. Similarly, the release of IL1, IL6 and TNFα stimulates the release of C-reactive protein by the liver and of tissue plasminogen activator, which gives rise to prothrombotic and inflammatory events, in addition to deposition of free fatty acids in muscle tissue, which leads to insulin resistance (IR).30,31 Thus, when the WC increases, as occurs in children with MS, there is also an increased risk of diabetes, cardiovascular disease32,33 or IR.34
When it came to lipid metabolism, we found higher levels of TG and lower levels of HDL (p < 0.01) in the subset of children with MS. This is consistent with the findings of Eyzaguirre et al., who have conducted similar studies in children and adolescents.35
Another of the risk factors associated with MS is high blood pressure. There are pathophysiological mechanisms that link high blood pressure to obesity, IR and changes in renal function.36 In our sample, we found differences between groups in both measures of blood pressure (p < 0.05).
In the group of children without MS, many had at least 1 risk factor, which is an important finding that must be taken into account for the purpose of prevention. Considering that at this age risk factors are modifiable, it would be reasonable to assume that they will either resolve or intensify over time depending on lifestyle. In our study, we found that 32.9% of boys (Figure 7) and 43.7% of girls (Figure 8) had 1 or 2 risk factors, a relevant finding that should be taken into consideration, for while these children do not currently have MS, it is possible that, under unfavourable circumstances, they may eventually develop it.
Our study found an alarming prevalence of overweight and obesity independently of the indicator used to identify them. Approximately half of the children had excess weight. Since obesity is a multifactorial problem, it is important to identify situations and environmental factors that are obesogenic.
In general, the promotion of physical activity in schools is small and insufficient due to current educational policies. Figure 10 shows that more than half of the children in the sample, independently of sex, only performed the physical activities included in the school curriculum, which usually consists of 2 periods a week (80 minutes) of physical activity. Thus, these children would fall into the irregular physical activity based on the categories defined using the IPAQ. The situation seems even direr if we consider that school activities are not always underway. When we stratified the results by sex, we found that 69.2% of boys and 69.0% of girls only engaged in physical activity in the framework of the academic curriculum (Figure 10).
We also found that 53.1% of boys and 47.7% of girls spent more than 2 hours a day in screen-related recreational activities (Figure 11). There is a demonstrated association between total screen time, obesity, and the risk factors mentioned above.37
CONCLUSIONS
The diagnosis of MS in childhood based on the presence of risk factors is currently difficult due to the heterogeneity of the criteria currently applied for its definition, but also due to the variability in the expression of its components, which differs compared to the adult population. When MS develops in childhood, there is a tendency for it to persist through adulthood, favouring the development of cardiovascular disease or type 2 diabetes.
As an emergent epidemiological phenomenon, MS is not exclusively found in adults, but also in paediatric populations. Based on the data collected in our study, in the town of Comodoro Rivadavia, we found a prevalence of 3.50% in boys and of 3.40% in girls, and the difference between the sexes was not statistically significant.
While the prevalence of abdominal obesity was higher in girls compared to boys, this was not associated with a higher prevalence of MS in the former.
All cases of MS occurred in children with overweight or obesity.
More than half of the sample did not engage in physical activity outside of school and spent more than 2 hours a day using electronic devices, a typical picture of current sedentary lifestyles.
We found modifiable risk factors for MB in the sample under study, such as low level of physical activity and excessive screen time.
CONFLICTS OF INTEREST
The authors have no conflicts of interest to declare in relation to the preparation and publication of this article.
ABBREVIATIONS
ATP III: Adult Treatment Panel III · bG: blood glucose · BMI: body mass index · BP: blood pressure · CDC: Centers for Disease Control and Prevention · CRP: C-reactive protein · HDL: high-density lipoprotein · IDF: International Diabetes Federation · IPAQ: International Physical Activity Questionnaire · IR: insulin resistance · LDL: low-density lipoprotein · MAP: mean arterial pressure · MS: metabolic syndrome · TG: triglycerides · VLDL: very low density lipoprotein · WC: waist circumference · WHO: World Health Organization.
REFERENCES
- Folch JJM, Folch BCM, Silvera MR, Cuervo DG, Jiménez JV, Jiménez DR. La comunicación en salud como aspecto clave en la vigilancia epidemiológica. Rev Med Electrón. 2016;38:635-7.
- Contreras F, Hernández P, Mata C, Hernández C. Síndrome metabólico y diabetes mellitus tipo 2 en población adulta. Los salías, Edo. Miranda-Venezuela. Síndrome Cardiometabólico. 2015;5:19-26.
- Herrera OA. Síndrome metabólico en la infancia, un enfoque para la Atención Primaria. Rev Cubana Pediatr. 2015;87:82-91.
- Gutiérrez Hervás AI, Rizo Baeza MM, Martínez Amorós N, Cortes Castell E. Presión sistólica, obesidad abdominal y grasa corporal, predictores del síndrome metabólico en preescolares españoles. Nutr Hosp. 2015;31:2109-14.
- Arslanian S, Suprasongsin C. Insulin sensitivity, lipids and body composition in childhood: is “syndrome X” present? J Clin Edocrinol Metab. 1996;81:1058-62.
- Grundy SM, Brewer HB Jr, Cleeman JI, Smith SC Jr, Lenfant C; American Heart Association; National Heart, Lung, and Blood Institute. Definition of metabolic syndrome: Report of the National Heart, Lung, and Blood Institute/American Heart Association conference on scientific issues related to definition. Circulation. 2004;109:433-8.
- Bitsori M, Kafatos A. Dysmetabolic syndrome in childhood and adolescence. Acta Paediatr. 2005;94:995-1005.
- Expert Panel on Detection, Evaluation, and Treatment of High Blood Cholesterol in Adults. Executive Summary of The Third Report of The National Cholesterol Education Program (NCEP) Expert Panel on Detection, Evaluation, And Treatment of High Blood Cholesterol In Adults (Adult Treatment Panel III). JAMA. 2001;285:2486-97.
- De Onis M, Onyango AW, Borghi E, Siyam A, Nishida Ch, Siekmann J. Development of a WHO growth reference for school –aged children and adolescents. Bull World Health Organ. 2007;85:660-7.
- The IDF consensus worldwide definition of the metabolic syndrome. In: International Diabetes Federation [online] [accessed 29/10/2019. Available at www.idf.org/e-library/consensus-statements/60-idfconsensus-worldwide-definitionof-the-metabolic-syndrome.html
- Cook S, Weitzman M, Auinger P, Nguyen M, Dietz WH. Prevalence of a metabolic syndrome phenotype in adolescents: findings from the third National Health and Nutrition Examination Survey, 1988-1994. Arch Pediatr y Adolesc Med. 2003;157:821-7.
- Ferranti SD, GauvreauuK, Ludwig DS, Neufeld EJ, Newburger JW, Rifai N. Prevalence of the metabolic syndrome in american adolescents. Circulation. 2004;110:2494-7.
- Weiss R, Dziura J, Burgert TS, Tamborlane WV, Taksali SE, Yeckel CW, Caprio S. Obesity and the metabolic syndrome in children and adolescents. New Engl J Med. 2004;350:2362-74.
- Pedrozo W, Castillo Rascón M, Bonneau G, Ibáñez de Pianesi M, Castro Olivera C, Jiménez de Aragón S. Síndrome metabólico y factores de riesgo asociados con el estilo de vida de adolescentes de una ciudad de Argentina, 2005. Rev Panam Salud Pública. 2008;24:149-60.
- Kuczmarski RJ, Ogden CL, Guo SS, Grummer-Strawn LM, Flegal KM, Mei Z, et al. 2000 CDC growth charts for the United States: methods and development. Vital Health Stat. 2002;1-190.
- Glicemia enzimática. In: Fundación Wiener Laboratorios SAIC [online] [accessed 29/10/2019]. Available at www.wiener-lab.com.ar/VademecumDocumentos/Vademecum%20espanol/glicemia_enzimatica_sp.pdf
- HDL colesterol. In: Fundación Wiener Laboratorios SAIC [online] [accessed 29/10/2019]. Available at www.wiener-lab.com.ar/VademecumDocumentos/Vademecum%20espanol/hdl_colesterol_ft_sp.pdf
- TG color. In: Fundación Wiener Laboratorios SAIC [online] [accessed 29/10/2019]. Available at www.wiener-lab.com.ar/VademecumDocumentos/Vademecum%20espanol/tg_color_gpo_pap_aa_liquida_sp.pdf
- O’Brien E, Waeber B, Parati B, Staessen J, Myers MG. Blood pressure measuring devices: recommendations of the European Society of Hypertension. BJM. 2001;322:531-6.
- Pate RR, Pratt M, Blair SN, Haskell WL, Macera CA, Bouchard C, et al. Physical activity and public health: a recommendation from the Centers for Disease Control and Prevention and the American College of Sports Medicine. JAMA. 195;273:402-7.
- Ruiz Vicente D, Salinero JJ, González Millán C, Soriano ML, Pastor TG, Theirs C, et al. Descripción de la práctica de actividad física, habilidades motrices básicas y composición corporal en niños y jóvenes de espectro autista. Diferencias por sexo. Retos. 2015;28:61-5.
- Reyes-Gómez U, Sánchez-Chávez NP, Reyes-Hernández U, Reyes-Hernández D, Carbajal-Rodríguez L,. La televisión y los niños: II obesidad. Bol Clin Hosp Infant Edo Son. 2006;23:25-30.
- Rossi RR. La obesidad infantil y los efectos de los medios electrónicos de comunicación. Redalyc. 2006;8:95-8.
- Olivares C, Bustos N, Lera L, Zelada ME. Estado nutricional, consumo de alimentos y actividad física en escolares mujeres de diferente nivel socioeconómico de Santiago de Chile. Rev Med Chile. 2007;135:71-8.
- Pagano M, Gauvreau K. Fundamentos de Bioestadística. 2nd Ed. International Thomson Editores; 2001.
- Chaila MZ, Fabio S, Quiroga E, Sánchez de Boeck N, Namur M, D’urso M, et al. Prevalencia de síndrome metabólico en niños y adolescentes según diferentes criterios diagnósticos y su correlación con niveles de leptina y adiponectina. Rev Argent Endocrinol Metab. 2012;49:103-14.
- Pires Rodríguez MDC, Nava Arias AV, Lanzilli P. Síndrome metabólico: prevalencia y factores de riesgo en escolares. Arch Venez Pueric Pediatr. 2009;72:47-52.
- Ochoa GMA, Arteaga RA. Prevalencia del síndrome metabólico en niños y adolescentes escolarizados del área urbana de la ciudad de Medellín. Iatreia. 2008;21:260-70.
- Reyes MV, Mederico M, de Valeri MP, Briceño Y, Zerpa Y, Gómez Pérez R. Síndrome metabólico en escolares y adolescentes de la ciudad de Mérida-Venezuela: comparación de resultados utilizando valores de referencia locales e internacionales (estudio CREDEFAR). Endocrinol Nutr. 2014;61:474-85.
- Stanley TL, Grinspoon SK. Effects of growth hormone-releasing hormone on visceral fat, metabolic, and cardiovascular índices in human studies. Growth Horm IGF Res. 2015;25:59-65.
- Andersson DP, Lofgren P, Thorell A, Arner P, Hoffstedt J. Visceral fat cell lipolysis and cardiovascular risk factors in obesity. Horm Metab Res. 2011;43:809-15.
- Despres JP. Cardiovascular disease under the influence of excess visceral fat. Crit Path Cardiol. 2007;6:51-9.
- Ruiz AJ, Aschner PJ, Puerta MF, Study Cristancho RA. IDEA study (International Day for the Evaluation of Abdominal Obesity): Primary care study of the prevalence of abdominal obesity and associated risk factors in Colombia. Biomedica. 2012;32:610-6.
- Morales A, Balza M, González M, Piña M, Zeman P, García D. Primeras curvas de percentiles de la circunferencia de cintura en un grupo de adolescentes del Estado Lara, Venezuela. Med Interna (Caracas). 2010;26:174-81.
- Eyzaguirre F, Silva R, Román R, Palacio A, Cosentino M, Vega V, et al. Prevalencia de síndrome metabólico en niños y adolescentes que consultan por obesidad. Rev Med Chile. 2011;139:732-8.
- Cordero A, Moreno J, Alegría E. Hipertensión arterial y síndrome metabólico. Rev Esp Cardiol. 2005;5:38-45.
- Aradillas García C, de la Cruz Mendoza E, Torres Ruvalcaba B, Montreal Escalante E, Torres Rodríguez L, Goldaracena Azuara M. El impacto de la televisión sobre la prevalencia del síndrome metabólico en población infantil de San Luis Potosí. Rev Fac Med UASLP. 2008;33:10-8.
Comments
This article has no comments yet.